Supply chain planning · demand first

Supply chain planning software that shows its work

Every forecast names what drove it. Every setting is a switch you own. Every number traces back to its inputs, on a platform that speaks your business’s vocabulary, not ours.

Complexity in Clarity out

See PlanSieve on your data

a working demo on your data · no commitment

Watch the film · under 3 min

A forecast review: demand and plan over time above the forecast worksheet, with a right-click menu on a forecast cell offering “What built this number?” and “Explain this cell”.
Real screens on a demo world; the brands are fictional.

The platform underneath

The data model, the algorithms, the connectors and the storage engine are all pluggable, so a new planning problem is configuration, not a rebuild.

Demand ships today on a core that is already built and acceptance-proven, and one configuration value switches its storage engine, with identical totals at both scales. The platform grades its own work, too: accuracy, bias and forecast value added are measured every cycle, including when a human change made the plan worse.

Measured in our lab, on our own test data, never a customer benchmark.What each number measures, and its caveats

The film

The film · Three problems, one platform

Every planning team knows these three. Here is what PlanSieve does about each.

0:002:58

Why PlanSieve

Four things the category has not been able to say

Each one is a mechanism, not an adjective, and each one is on screen.

Every number can be asked why.

Right-click any forecast and the answer is about that number: its base, each driver’s push, the model that won and by how much, and what moved since the last cycle.

Where the arithmetic is exact we draw the waterfall. Where it is a proportional share we say so in words instead of drawing one that would lie.

Nothing is a black box
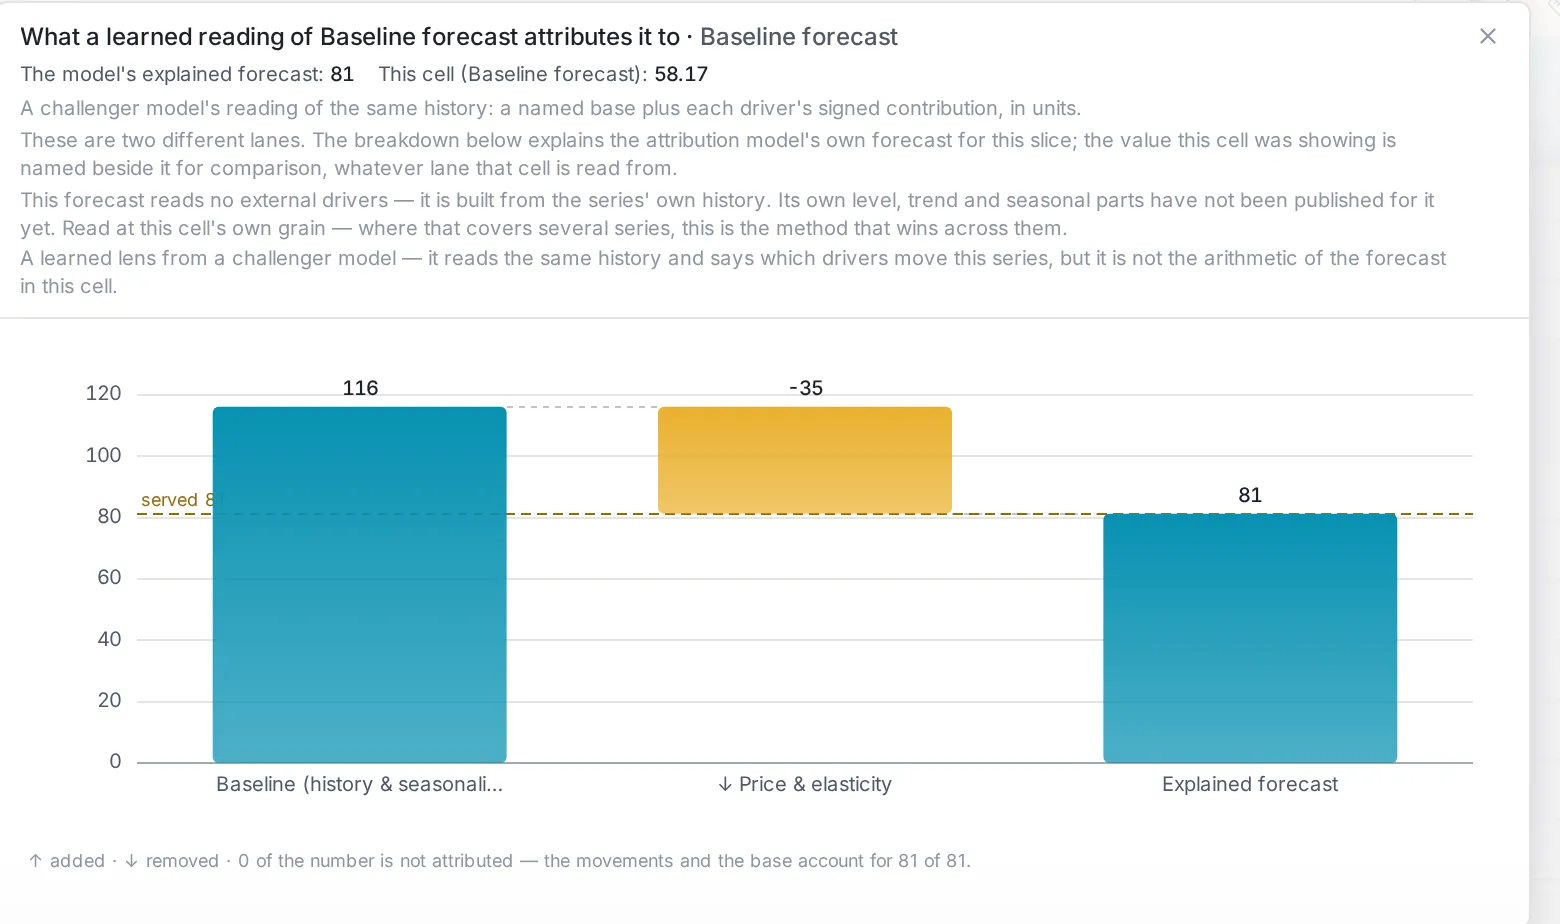
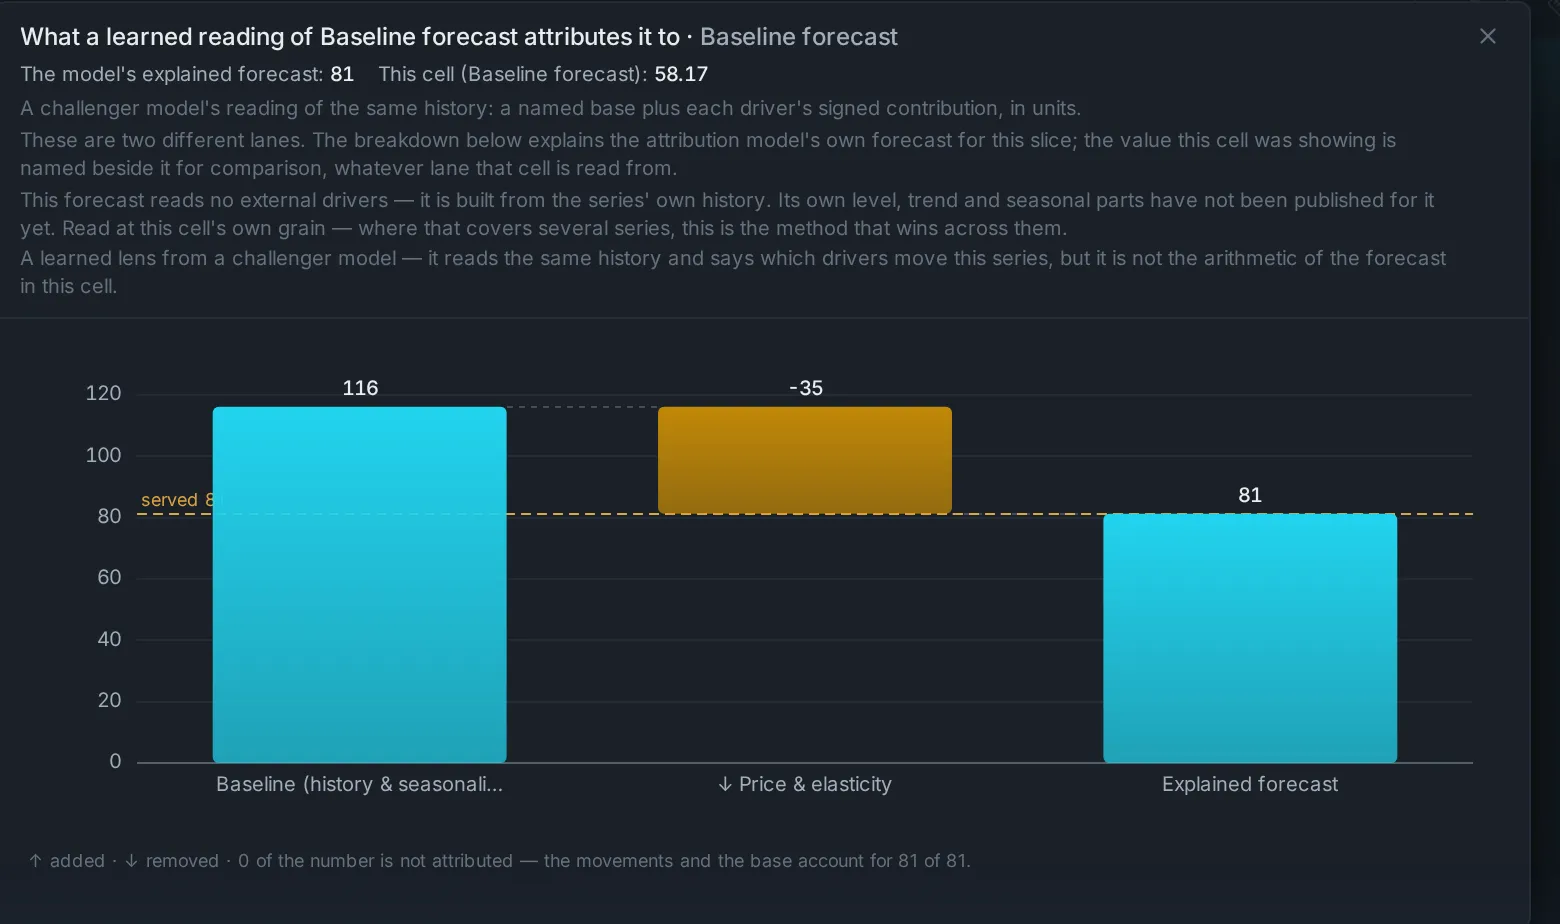
What built this number: a waterfall for one forecast cell: the baseline from the series’ own history, a driver’s signed push, and the explained forecast, with the plain-language reading above it.What built this number: a waterfall for one forecast cell: the baseline from the series’ own history, a driver’s signed push, and the explained forecast, with the plain-language reading above it.
What built this number?The explanation is of the number you clicked, declared by the rule that authored it, never inferred.

It will tell you when it was wrong. It will tell you when you were.

Accuracy, bias and forecast value added are measured every cycle, at any level you look, by the one definition every screen shares.

When a hand-made change made the forecast worse, that is on the page as well, as a number, not a scolding. Authority earned with evidence is the only kind a planning system keeps.

How the platform grades its own work
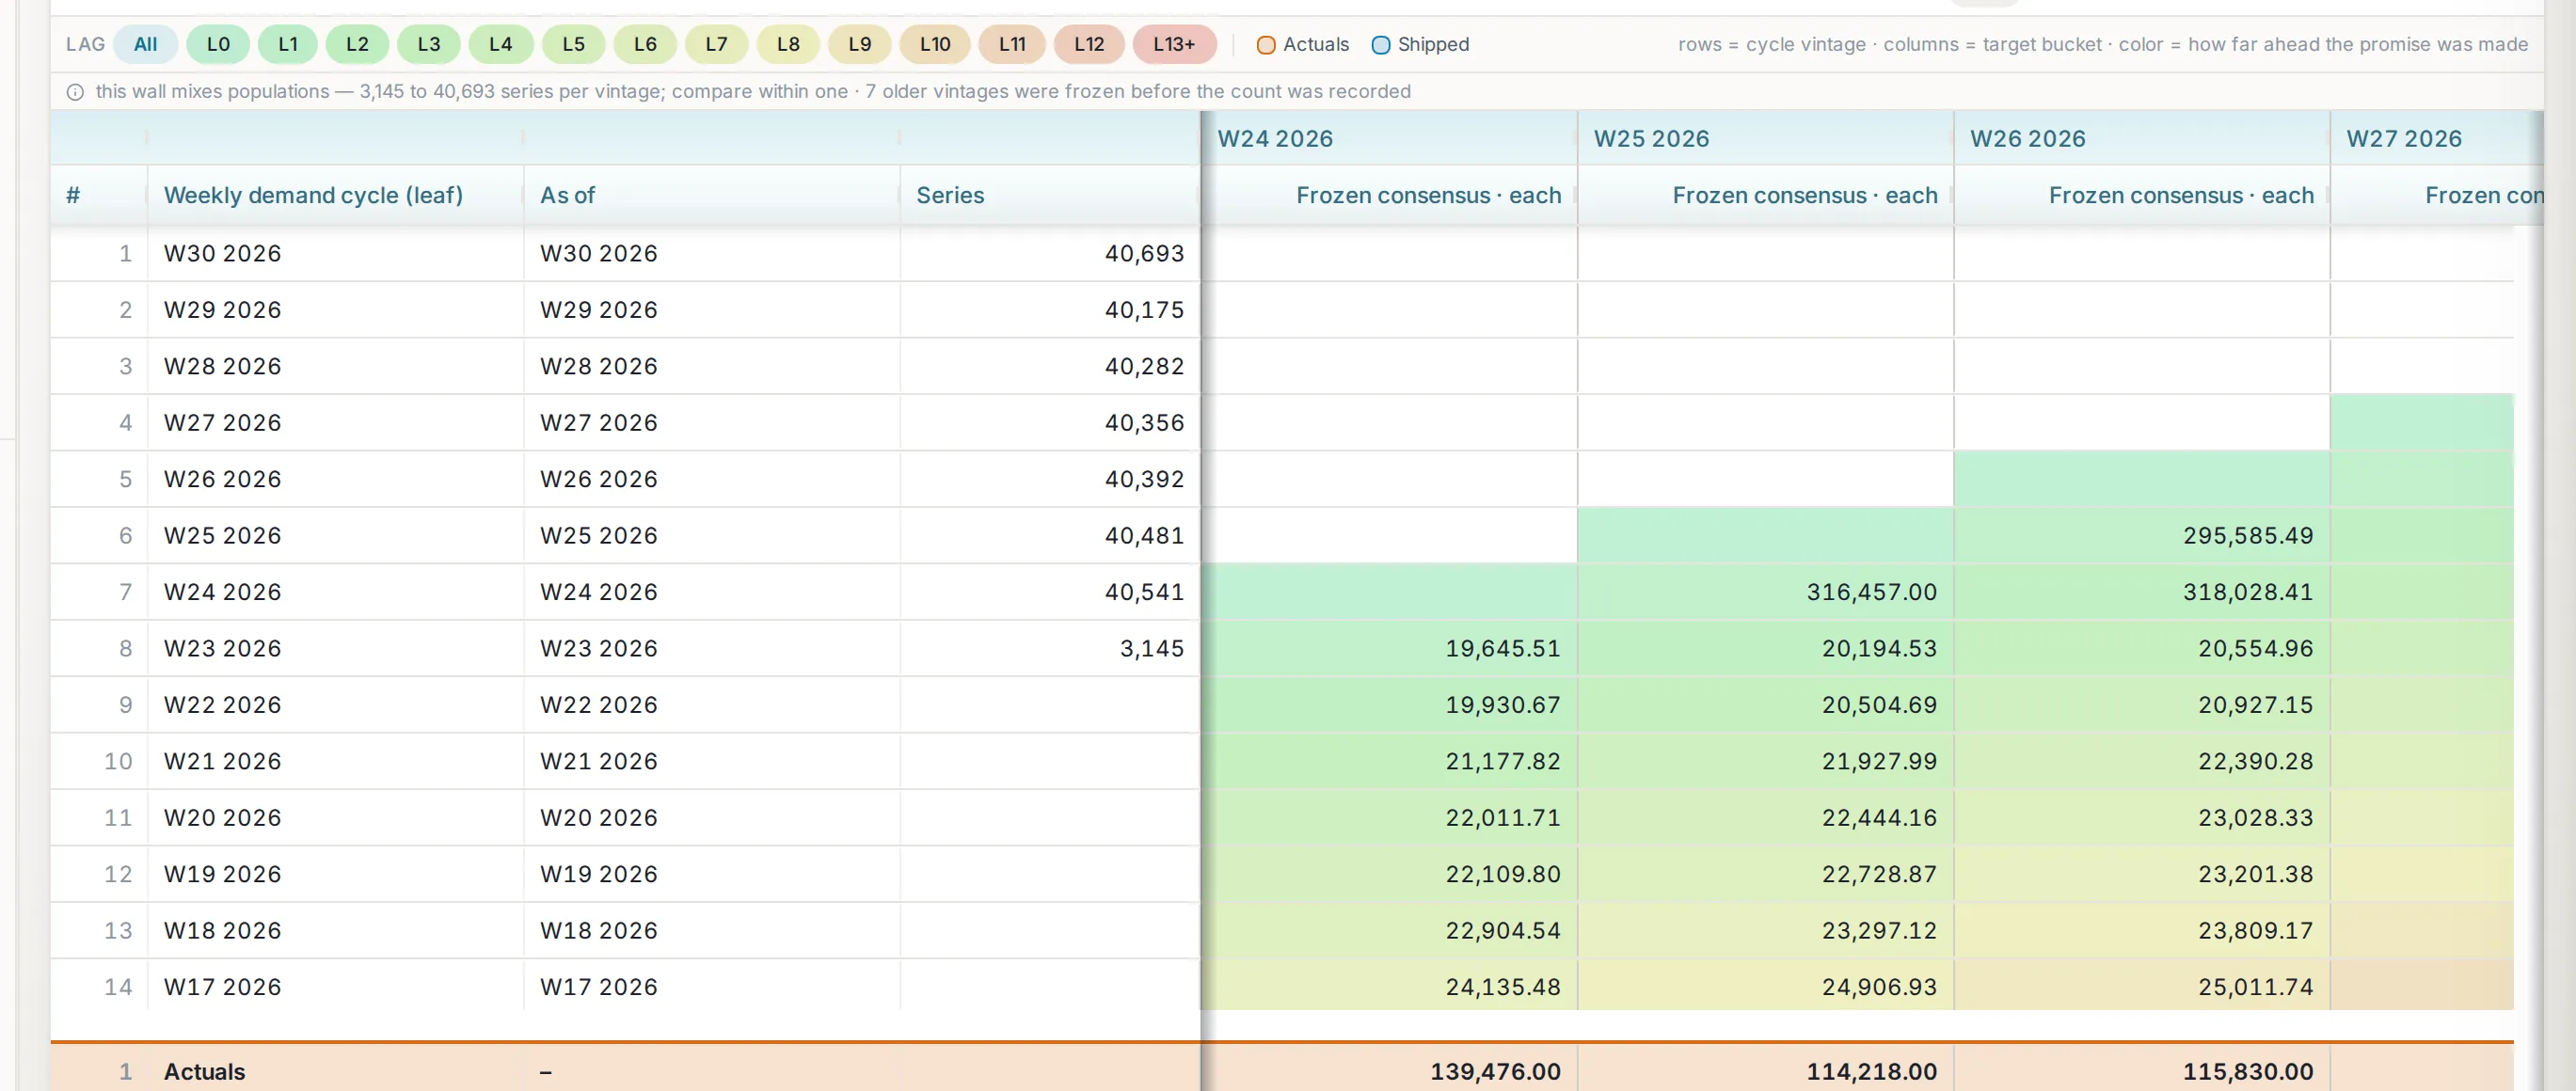
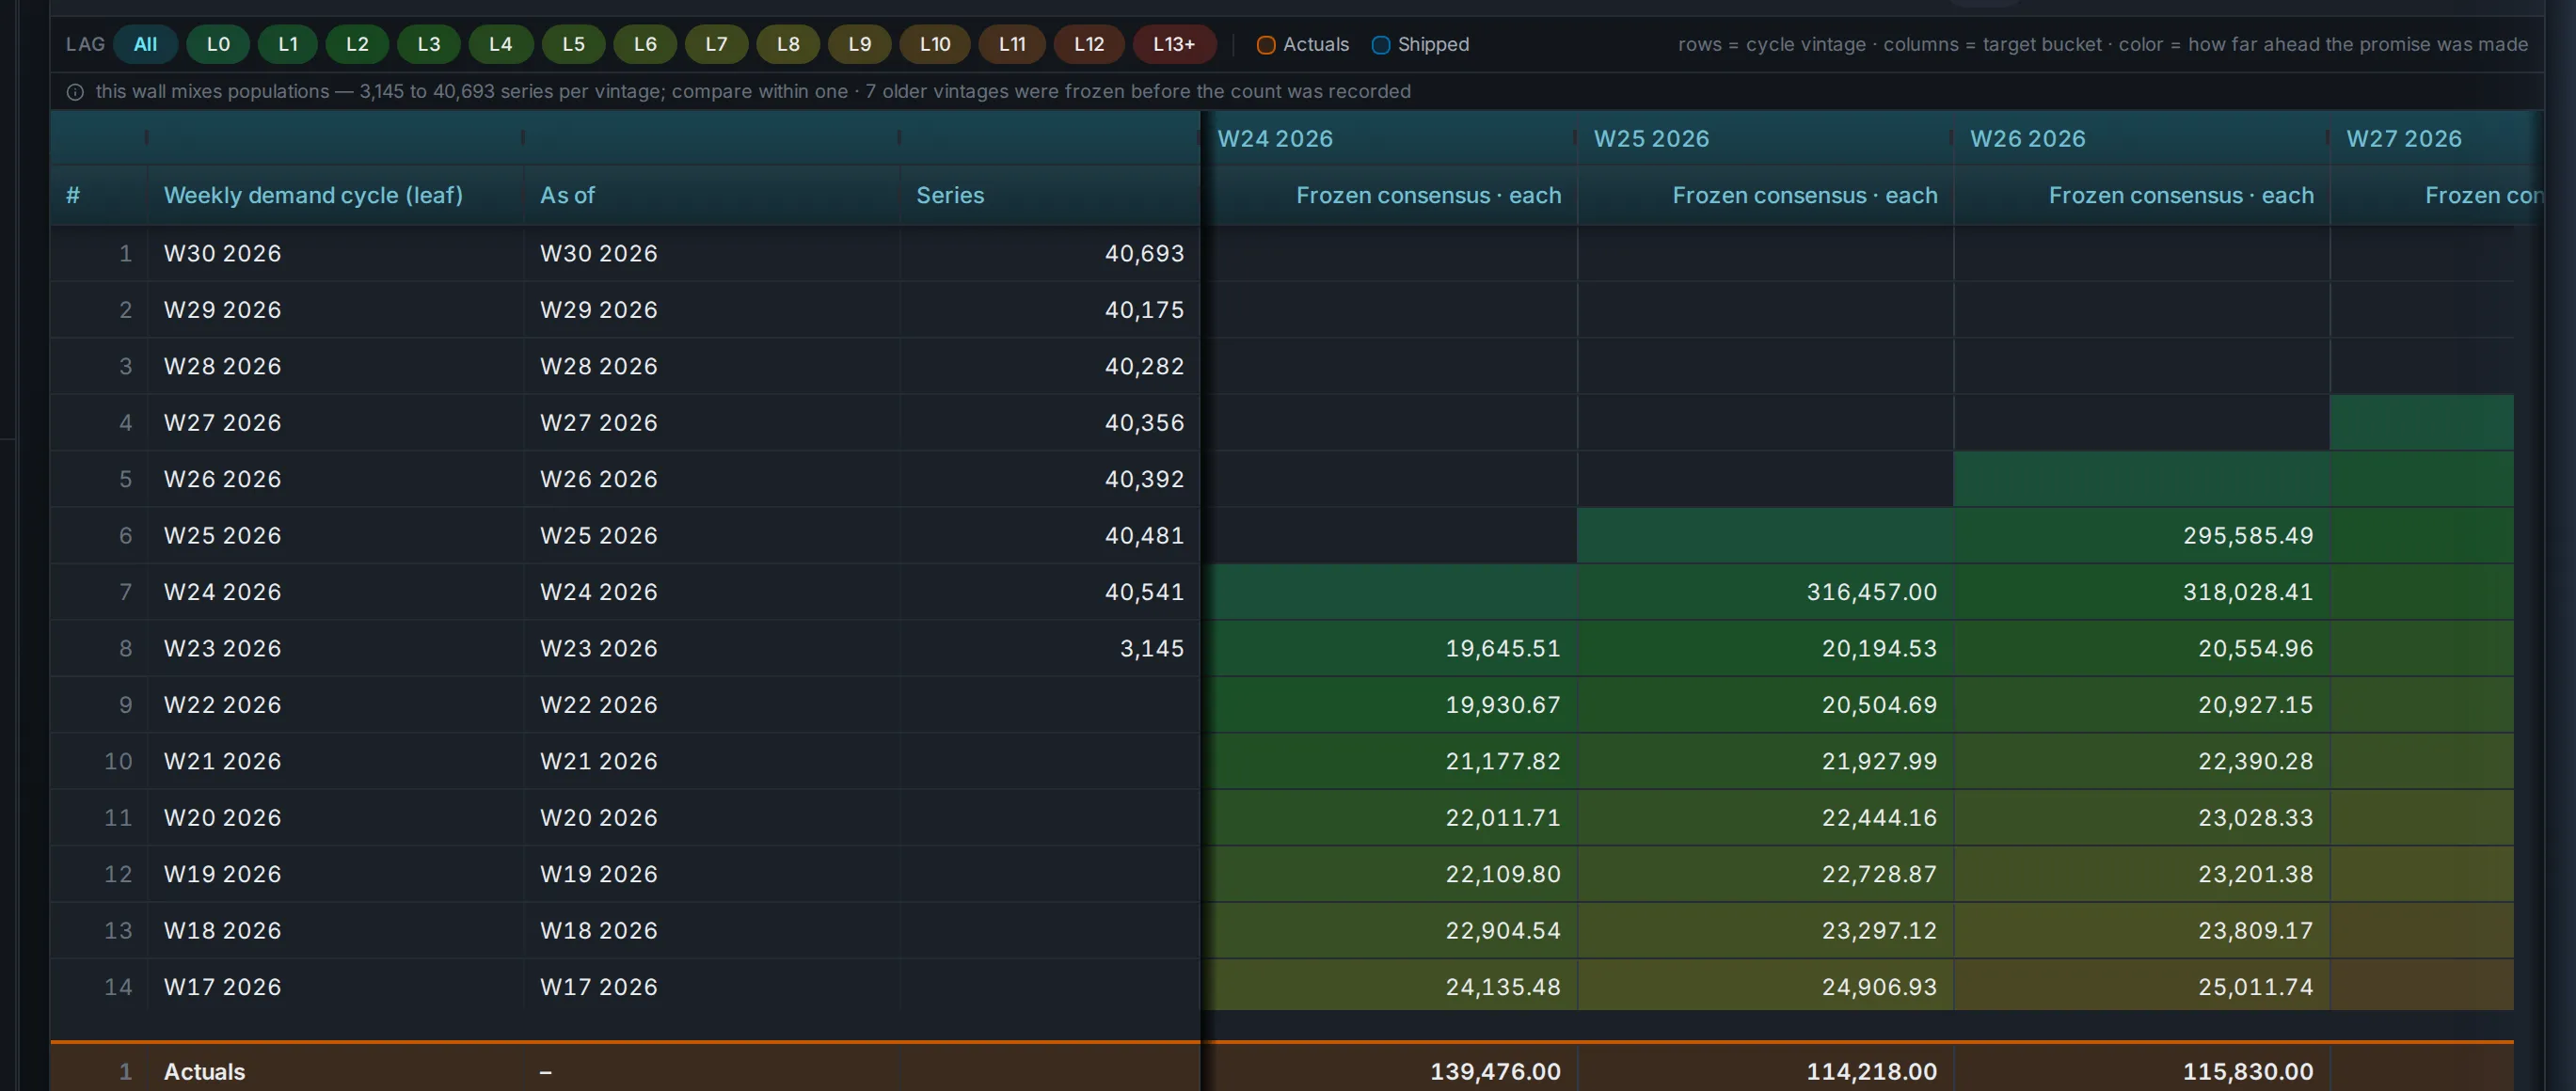
The accuracy staircase: each frozen weekly cycle’s promise against what happened, one row per vintage, coloured by how far ahead the promise was made.The accuracy staircase: each frozen weekly cycle’s promise against what happened, one row per vintage, coloured by how far ahead the promise was made.
Accuracy staircaseAccuracy at every lag, over the frozen cycles: one metric dictionary, no ratio-of-aggregates.

The engine came first. The modules are configuration.

Everything a planning module is, its measures, rules, pages, policies and model bindings, is metadata, so a module arrives as a package you switch on, not a release you wait for.

Demand is the first package on that core. Inventory, supply and S&OP are carried by the same data model, by design. None of them is listed as available until it is.

Open by design
The Designer Studio: a product dimension’s roll-up path from family to category, subcategory and item, with attributes waiting to be dragged into it, authored from the interface, no code.The Designer Studio: a product dimension’s roll-up path from family to category, subcategory and item, with attributes waiting to be dragged into it, authored from the interface, no code.
Designer StudioA module is authored here, as configuration, the dimension, its levels, the measures and how they spread, on the one core.

One core, from a single site to a billion rows.

The fact store is an adapter, not a dependency: embedded columnar on a laptop, a scale-out column store in production, and a cloud-warehouse adapter designed behind the same contract, with Apache Arrow as the interchange in between.

The model, the math and the screens do not change when you move. The configuration does. We measured a billion-row fact table on the scale-out setup; the numbers, with their caveats, are on the measured-performance page.

The engine, and what it was measured doing
A governed run’s own record: what it ran on, with which parameters, and every measure it wrote.A governed run’s own record: what it ran on, with which parameters, and every measure it wrote.
Jobs & runsA governed run’s scope record: the same job, and the same record, whichever fact store sits behind the contract.

The rest of the eighteen

And fourteen more, each with a page behind it

No badge without a page. Every line here is substantiated in full on the platform page.

  1. One gesture, and the whole plan hears you.Keep, correct, mask or declare an event, stored as data that the cleansing engine, the model contest and the next cycle all read.
  2. We let the model say no.Every driver you switch on is backtested per series; when it does not earn its seat, the page says so in words, with the score beside it.
  3. Every setting is yours, at the level you pick.A switch with a dial, pinned at a category, a region, a channel or a single item, inherited downward, and off provably skips.
  4. Define it once. Use it everywhere.One filter grammar for grids, charts, runs, alert queues and access rules. A saved selection is portable across the whole product.
  5. Built so software can read it, not just people.Every capability is served by a documented door and the model describes itself, agent-ready by construction.
  6. Your business’s words, not ours.Dimensions, levels, hierarchies and grains are data, not schema. Adding an axis is a metadata change, with no migration.
  7. Plan where you think. It lands where it must.Every measure declares how it spreads; locked cells stay locked and the totals still tie.
  8. What-if, without the copy.A scenario stores only the cells you changed. Branch it, compare it, promote the parts you want.
  9. Budgets, not adjectives.Every performance claim is an assertion inside the test suite, with a millisecond ceiling that fails the build when crossed.
  10. Permissions that hold on every door.Isolation is enforced in the database itself, and what you may see narrows every grid, run, export, scenario and explanation.
  11. A contest for every series, every cycle.Simple, classical, intermittent and machine-learning methods compete on each series’ own history; the winner is named on the grid.
  12. Your model, our contest, one contract.Register a model or a solver and it competes exactly as ours do: sandboxed, permissioned, scored by the same backtest.
  13. If it changes the business, it’s a screen.Measures, formulas, rules, pages, policies and actions are authored in the product and versioned like everything else.
  14. Nothing changes without a record.Versioned configuration, auditable edits, immutable published cycles, and upgrades that arrive as a three-way diff.

A planner’s day

Three moments a planner actually has

Not a feature list. The morning worklist, the question about a driver, and the model that won.

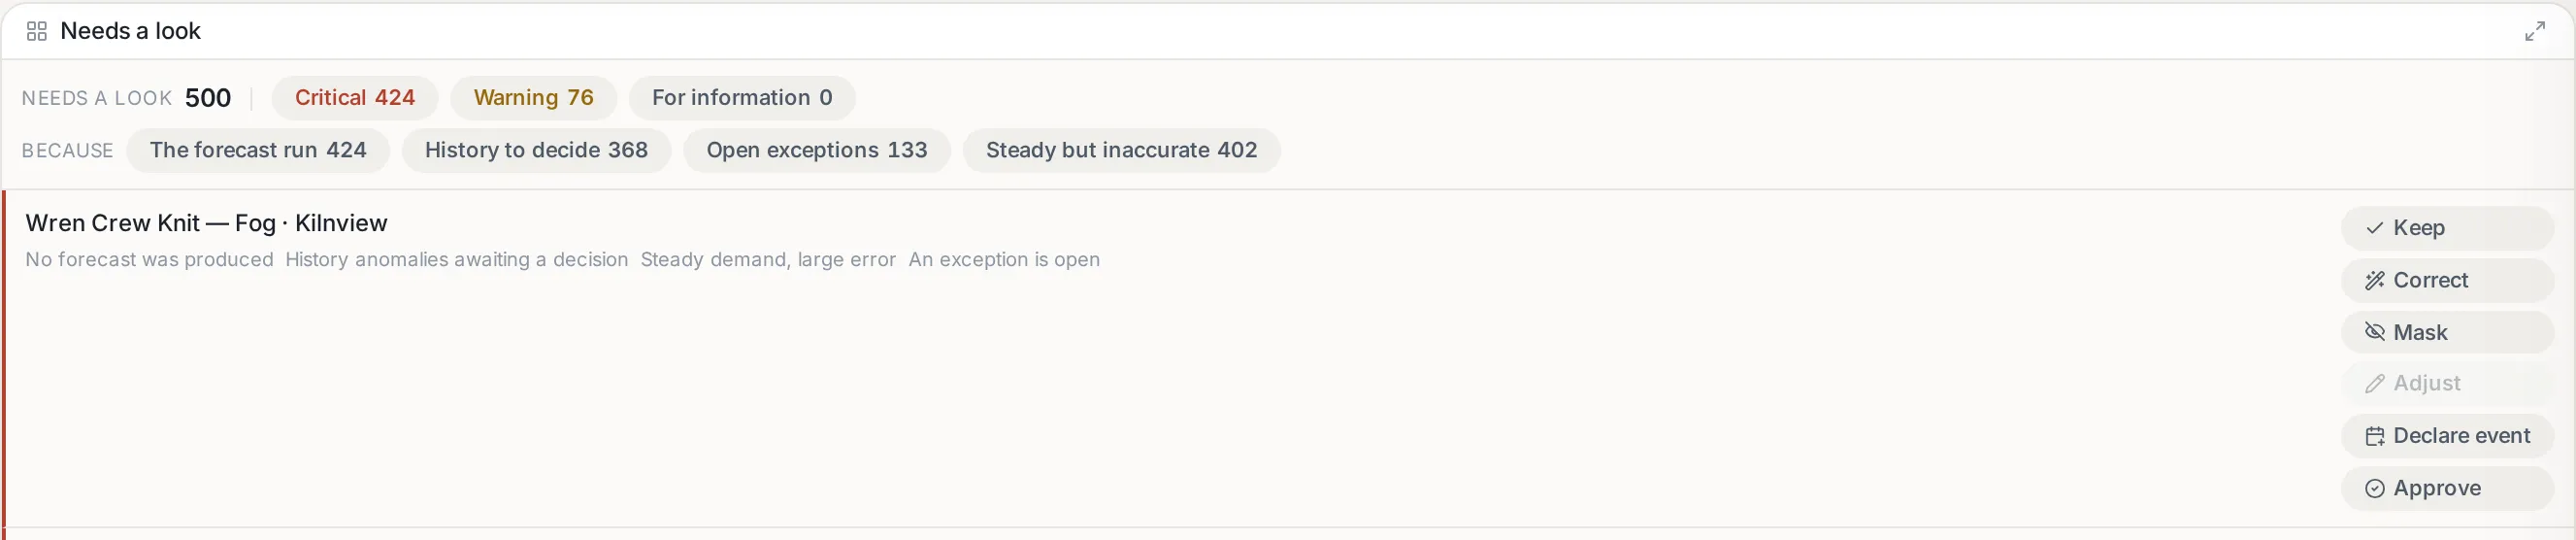
The review queue: what needs a look and why, with counts by severity and reason, the first series with its open questions, and its verdict verbs (keep, correct, mask, adjust, declare an event, approve).The review queue: what needs a look and why, with counts by severity and reason, the first series with its open questions, and its verdict verbs (keep, correct, mask, adjust, declare an event, approve).

One gesture, and the whole plan hears you.

Keep it, correct it, mask it, or name it as an event. Each is a single click with the evidence sitting beside it. The verdict is stored as data, not as a note, so the cleansing engine, the model contest and the next cycle all read it.

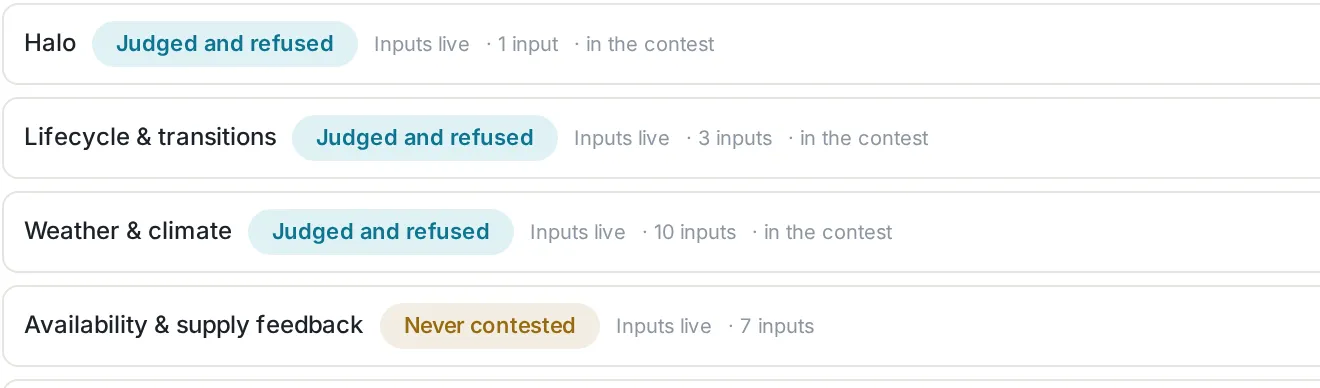
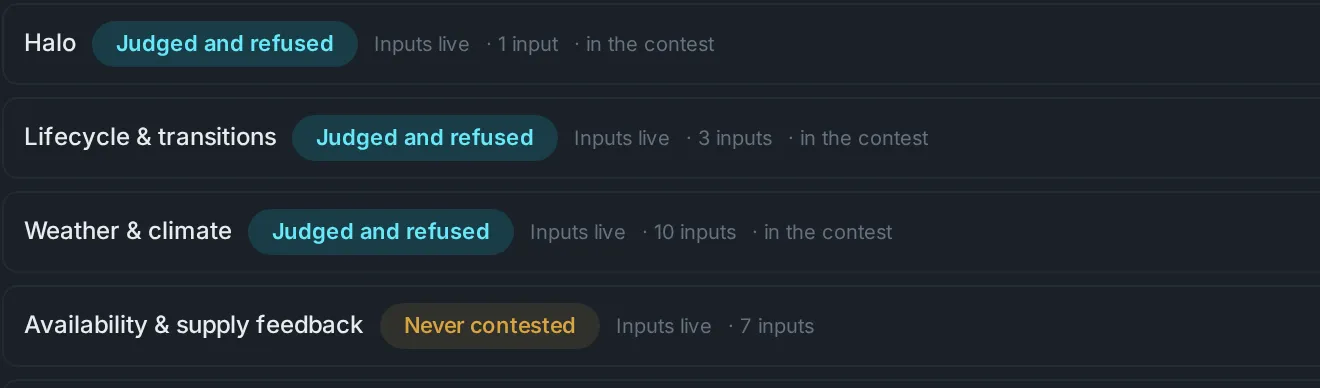
Did this signal earn its seat: driver families listed one per row: halo, lifecycle and transitions, weather and climate each marked “Judged and refused”, one marked “Never contested”.Did this signal earn its seat: driver families listed one per row: halo, lifecycle and transitions, weather and climate each marked “Judged and refused”, one marked “Never contested”.

We let the model say no.

Every driver you switch on (weather, price, promotion, events) is backtested against the series it claims to explain. If it does not improve the forecast, it does not get a seat, and the page says so in plain words with the score beside it. A tool that only ever agrees with itself is not evidence. A refusal is.

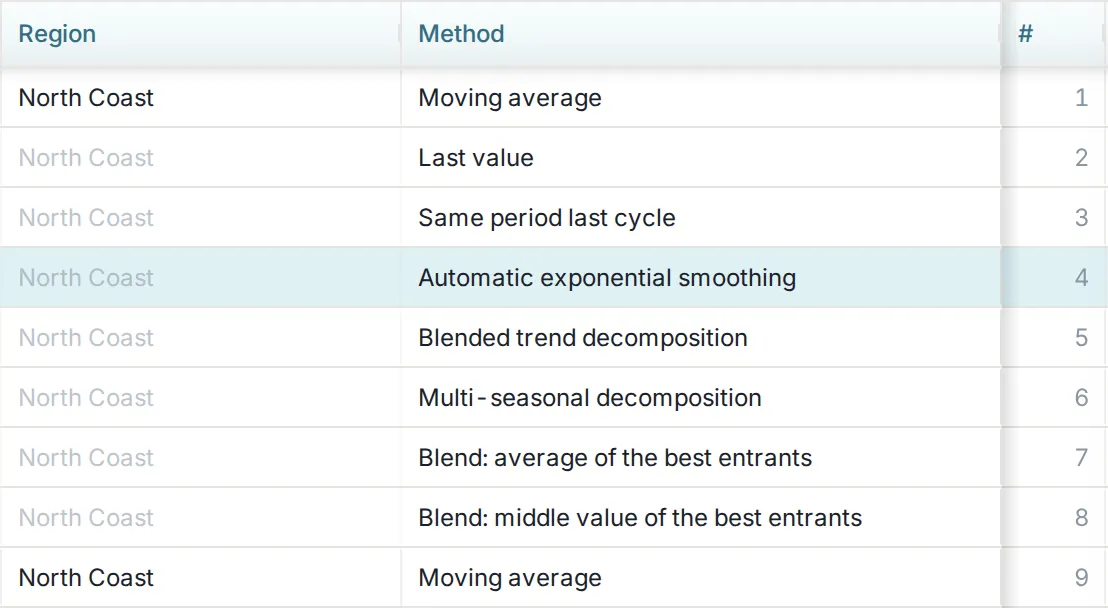
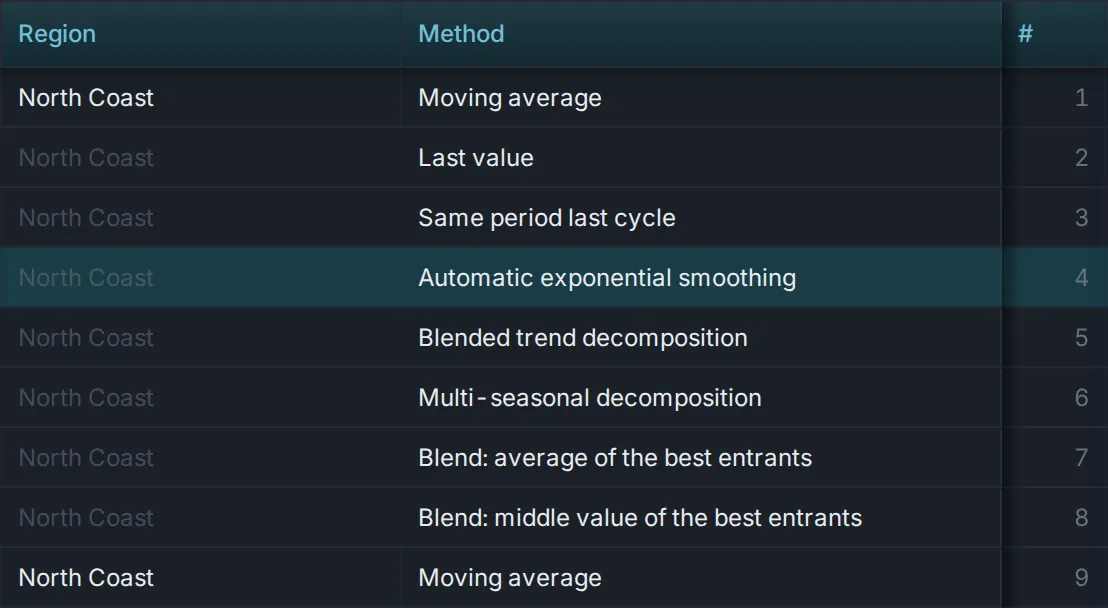
The model contest scoreboard: the methods that competed on one series, ranked (moving average, last value, same period last cycle, exponential smoothing, trend and seasonal decompositions, and blends of the best entrants).The model contest scoreboard: the methods that competed on one series, ranked (moving average, last value, same period last cycle, exponential smoothing, trend and seasonal decompositions, and blends of the best entrants).

A contest for every series, every cycle.

Simple methods, classical statistics, intermittent-demand methods and machine learning all compete on each series’ own history, scored on the same accuracy definition used everywhere else. The winner is named on the grid, the scoreboard shows every challenger and the margin, and the ranges come from the model that won.

The demand module, end to end

How it works

Your vocabulary in. Clarity out.

Three steps, and the second one is the engine.

  1. Your vocabulary in

    Model your dimensions, levels and hierarchies in the Designer. They are data, not schema. Load history through the connector plane. Set policies once, at the level you choose.

  2. The engine

    A contest per series picks the model and names why. Spreading respects your locks and ties the totals. Every step runs inside a measured budget that fails the build if it slips.

  3. Clarity out

    Every number explains itself. The platform grades its own accuracy, bias and value added. A verdict is one gesture, and every engine downstream hears it.

How an implementation runs

Deeper proof

The questions a careful buyer asks first

How do planner overrides reach the model?

A verdict, keep, correct, mask, declare an event, adjust or approve, is not a note on the side. It lands as data on the history itself, through the same governed edit path every other number uses, with a reason and a date stamp. The cleansing engine, the model contest and the next cycle all read it, so judgement stops being an override the system fights and becomes an input the system uses.

The demand module, in a planner’s day

What happens when we want inventory or supply planning?

Demand planning is the module available today. Inventory, supply, manufacturing and sales-and-operations planning are carried by the data model by design: the engine has no module-specific code in it, and a module is a versioned package of metadata you activate, diff and upgrade rather than a release you wait for. We do not list them as available until they are.

Modules, honestly

How does it behave at our volumes?

Every performance claim we make is an assertion inside our own test suite: a pivot page, an edit reaching its downstream measures, a full cascade, each with a millisecond ceiling that fails the build when it is crossed. We have measured the same product on a laptop-class embedded store and on a billion-row fact table on the scale-out setup; the numbers, with what each one measures and its caveats, are on the measured-performance page.

Measured, not promised

One objection per differentiator, answered

See PlanSieve on your data

Bring your history, your hierarchies and your vocabulary. We show the platform working on them.

Request a demo

a working demo on your data · no commitment