Modules · Demand planning
A planner’s day, on one surface
The demand module is the platform’s first application. Here is the day it is built around: the morning worklist, a verdict in one gesture, a number that explains itself, a policy set once at the level you choose, and a model contest for every series.
The surface
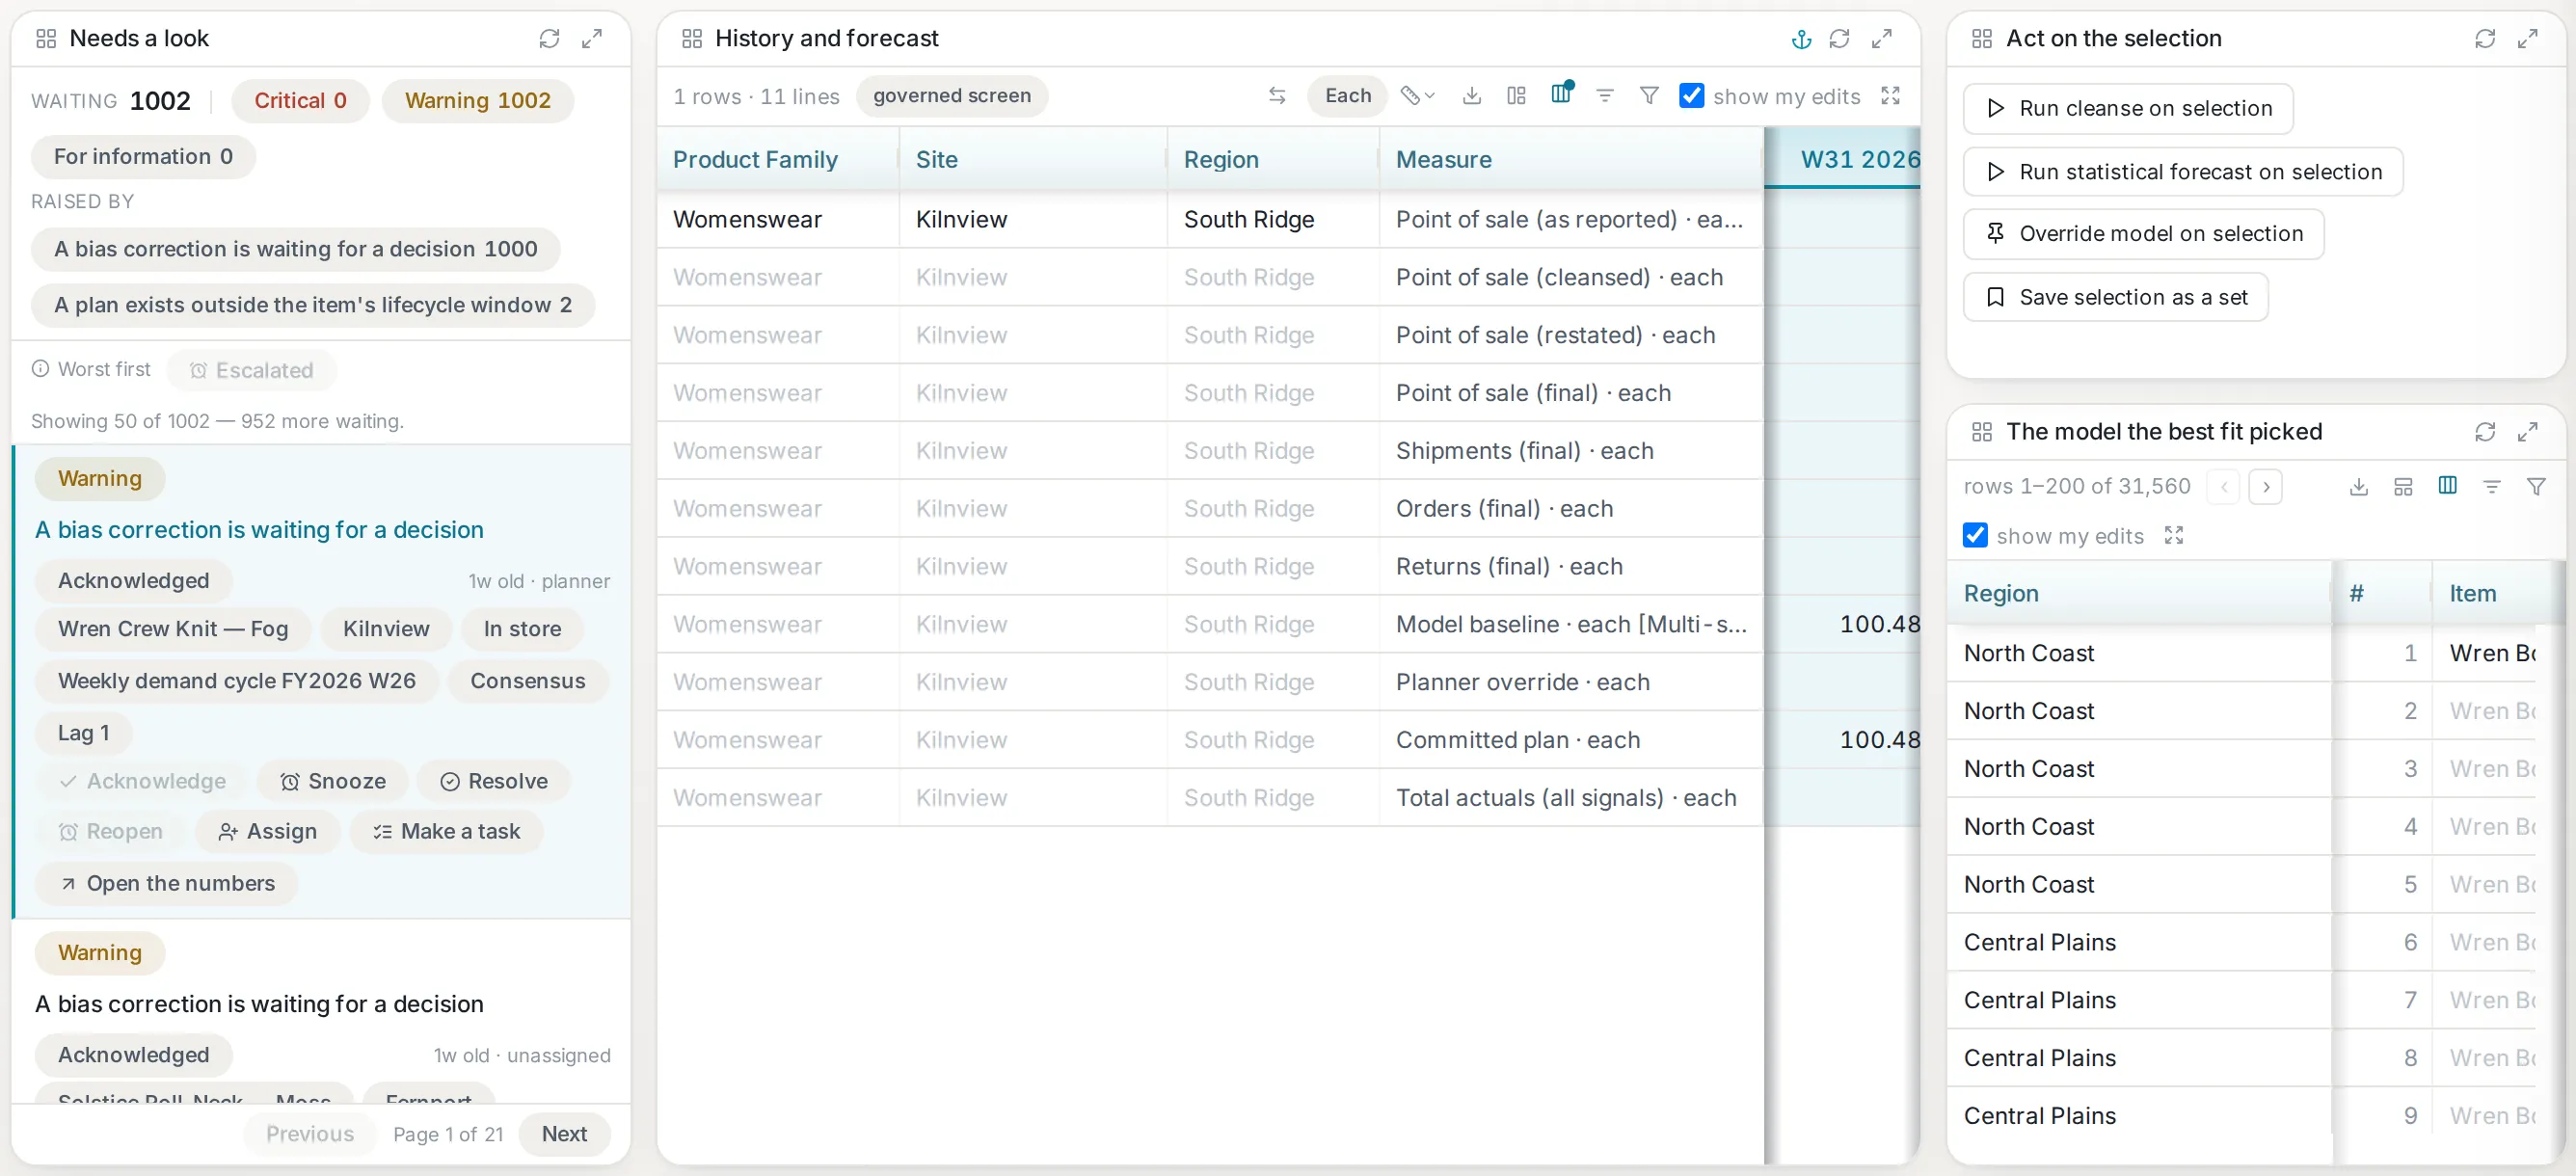
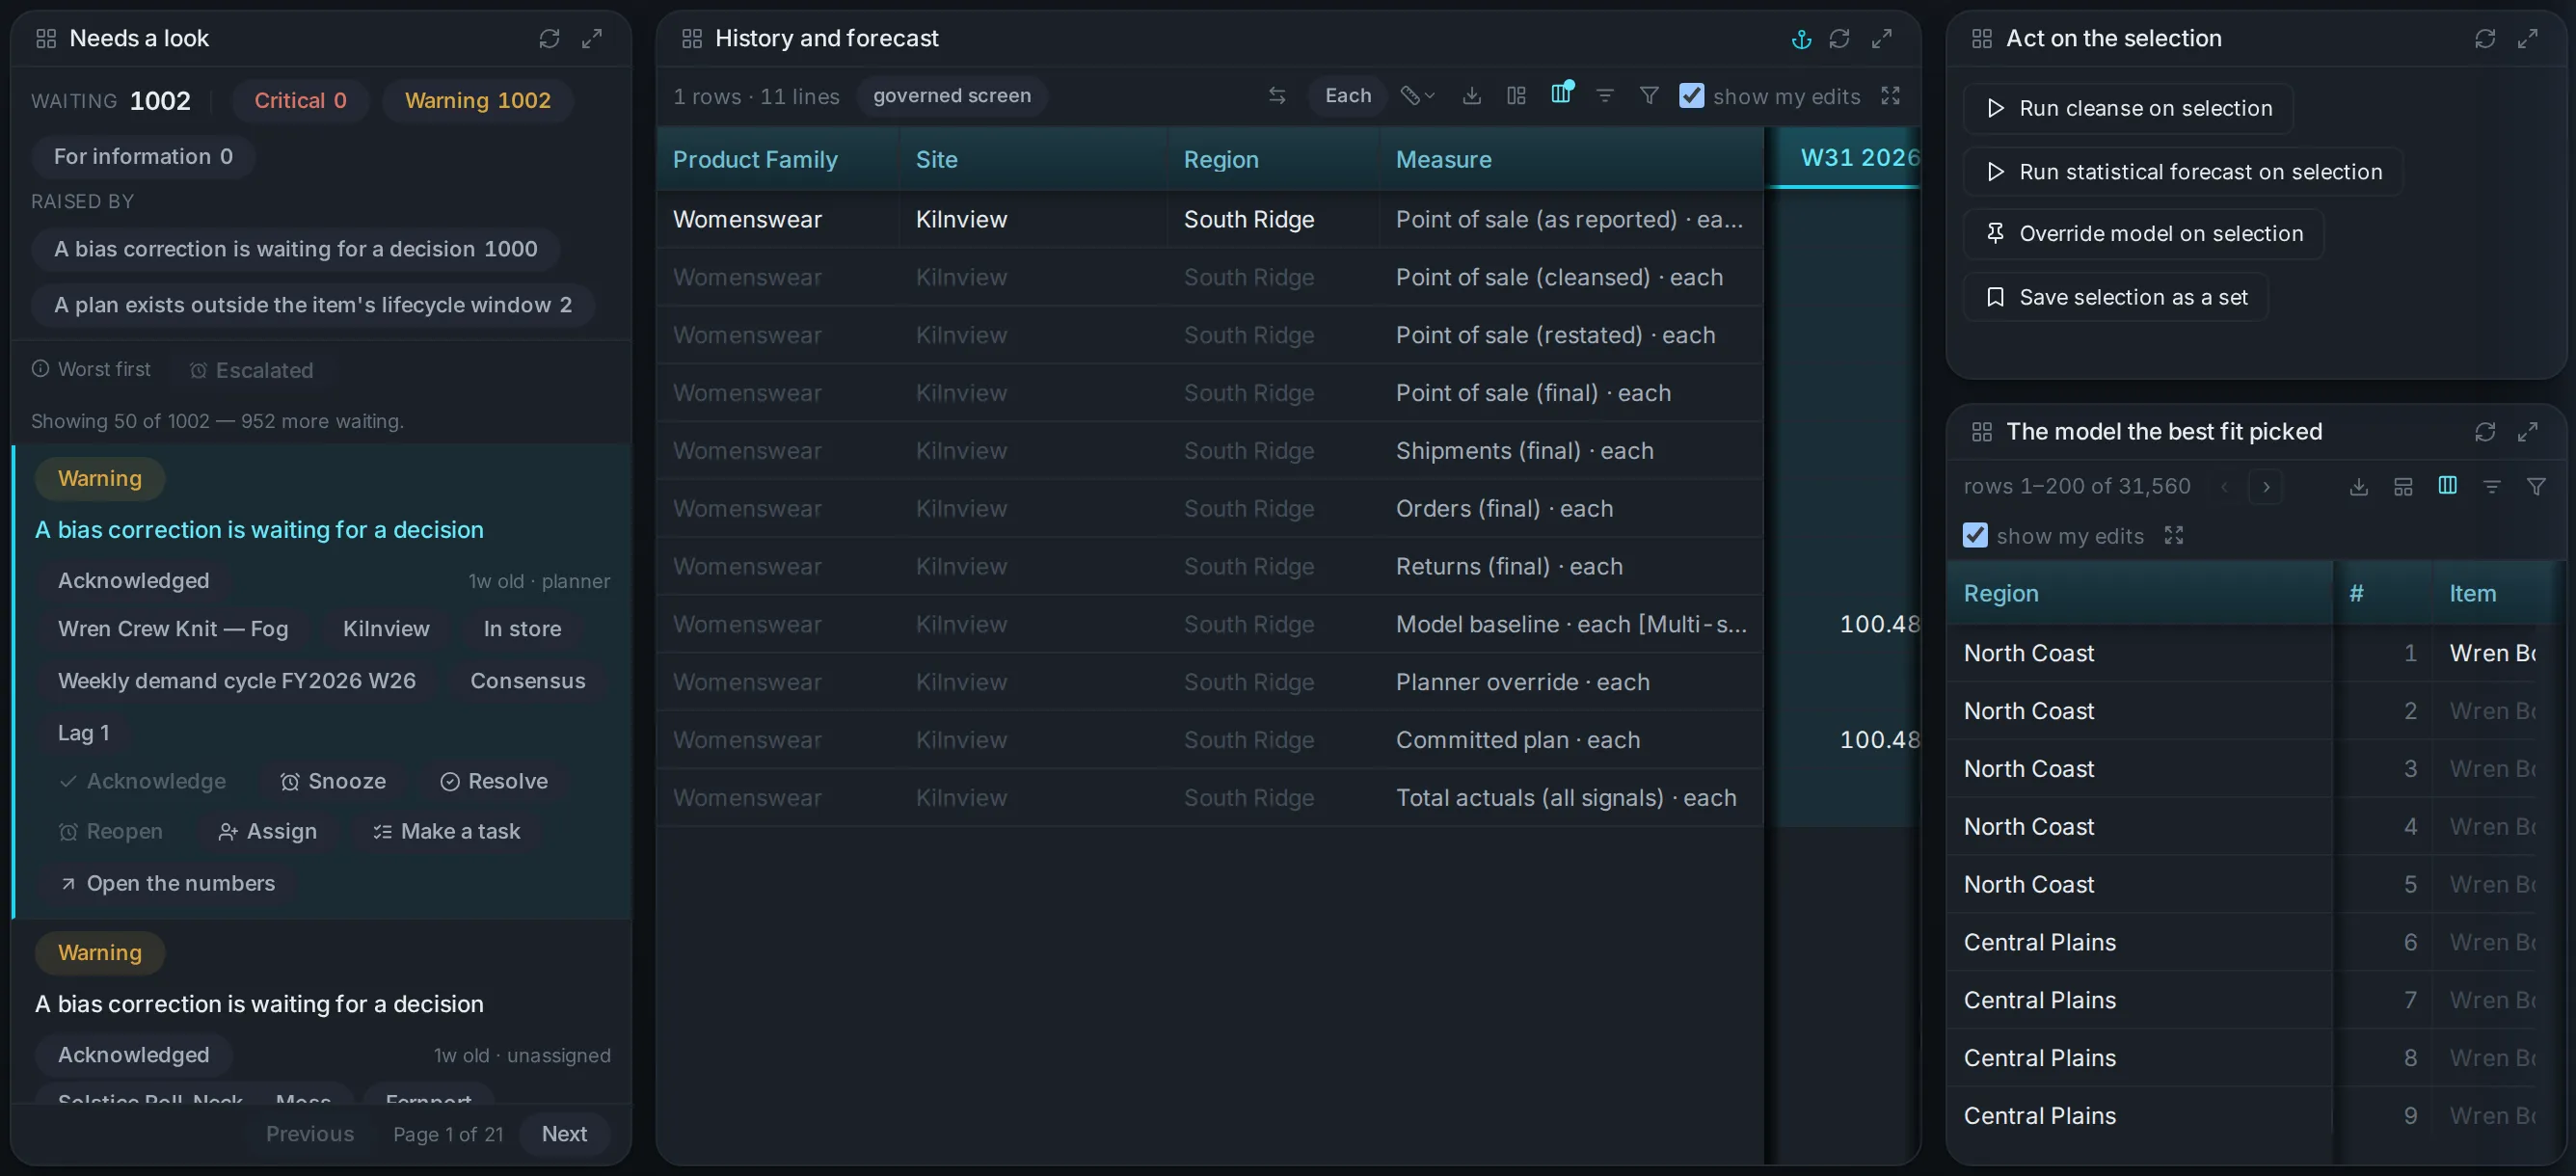
Queue on the left. History and forecast in the centre. The moves you can make on the right. One screen, so the evidence sits beside the action.
01 · The worklist
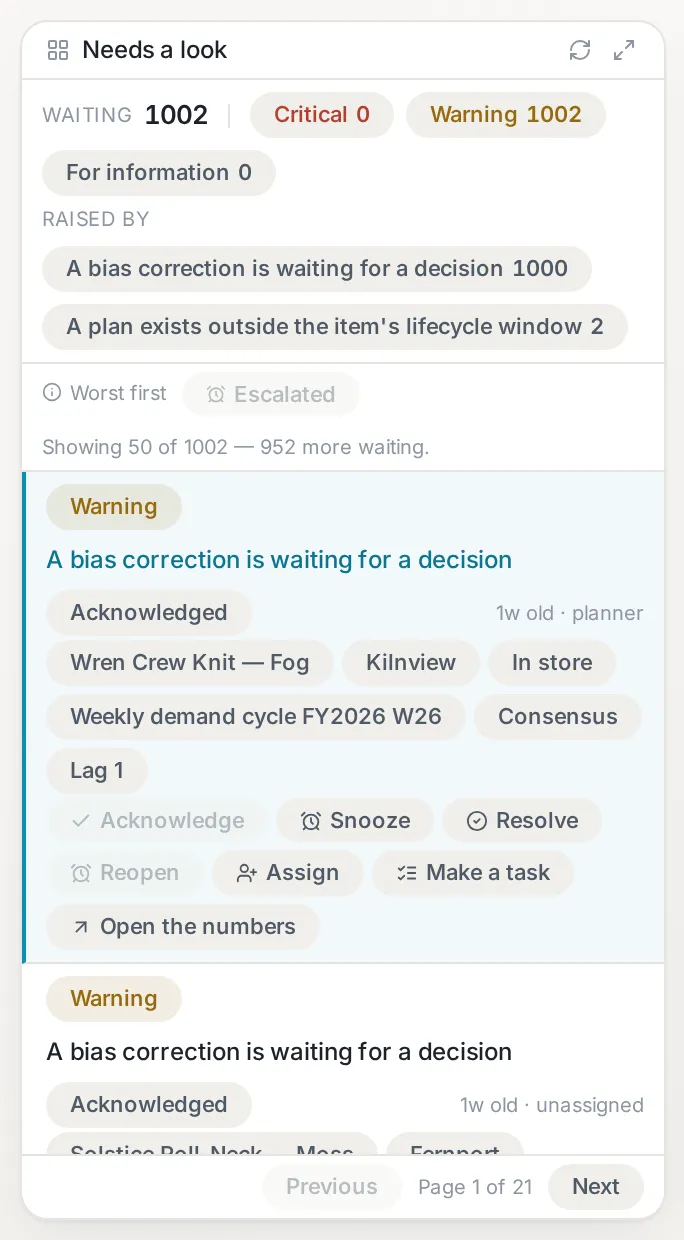
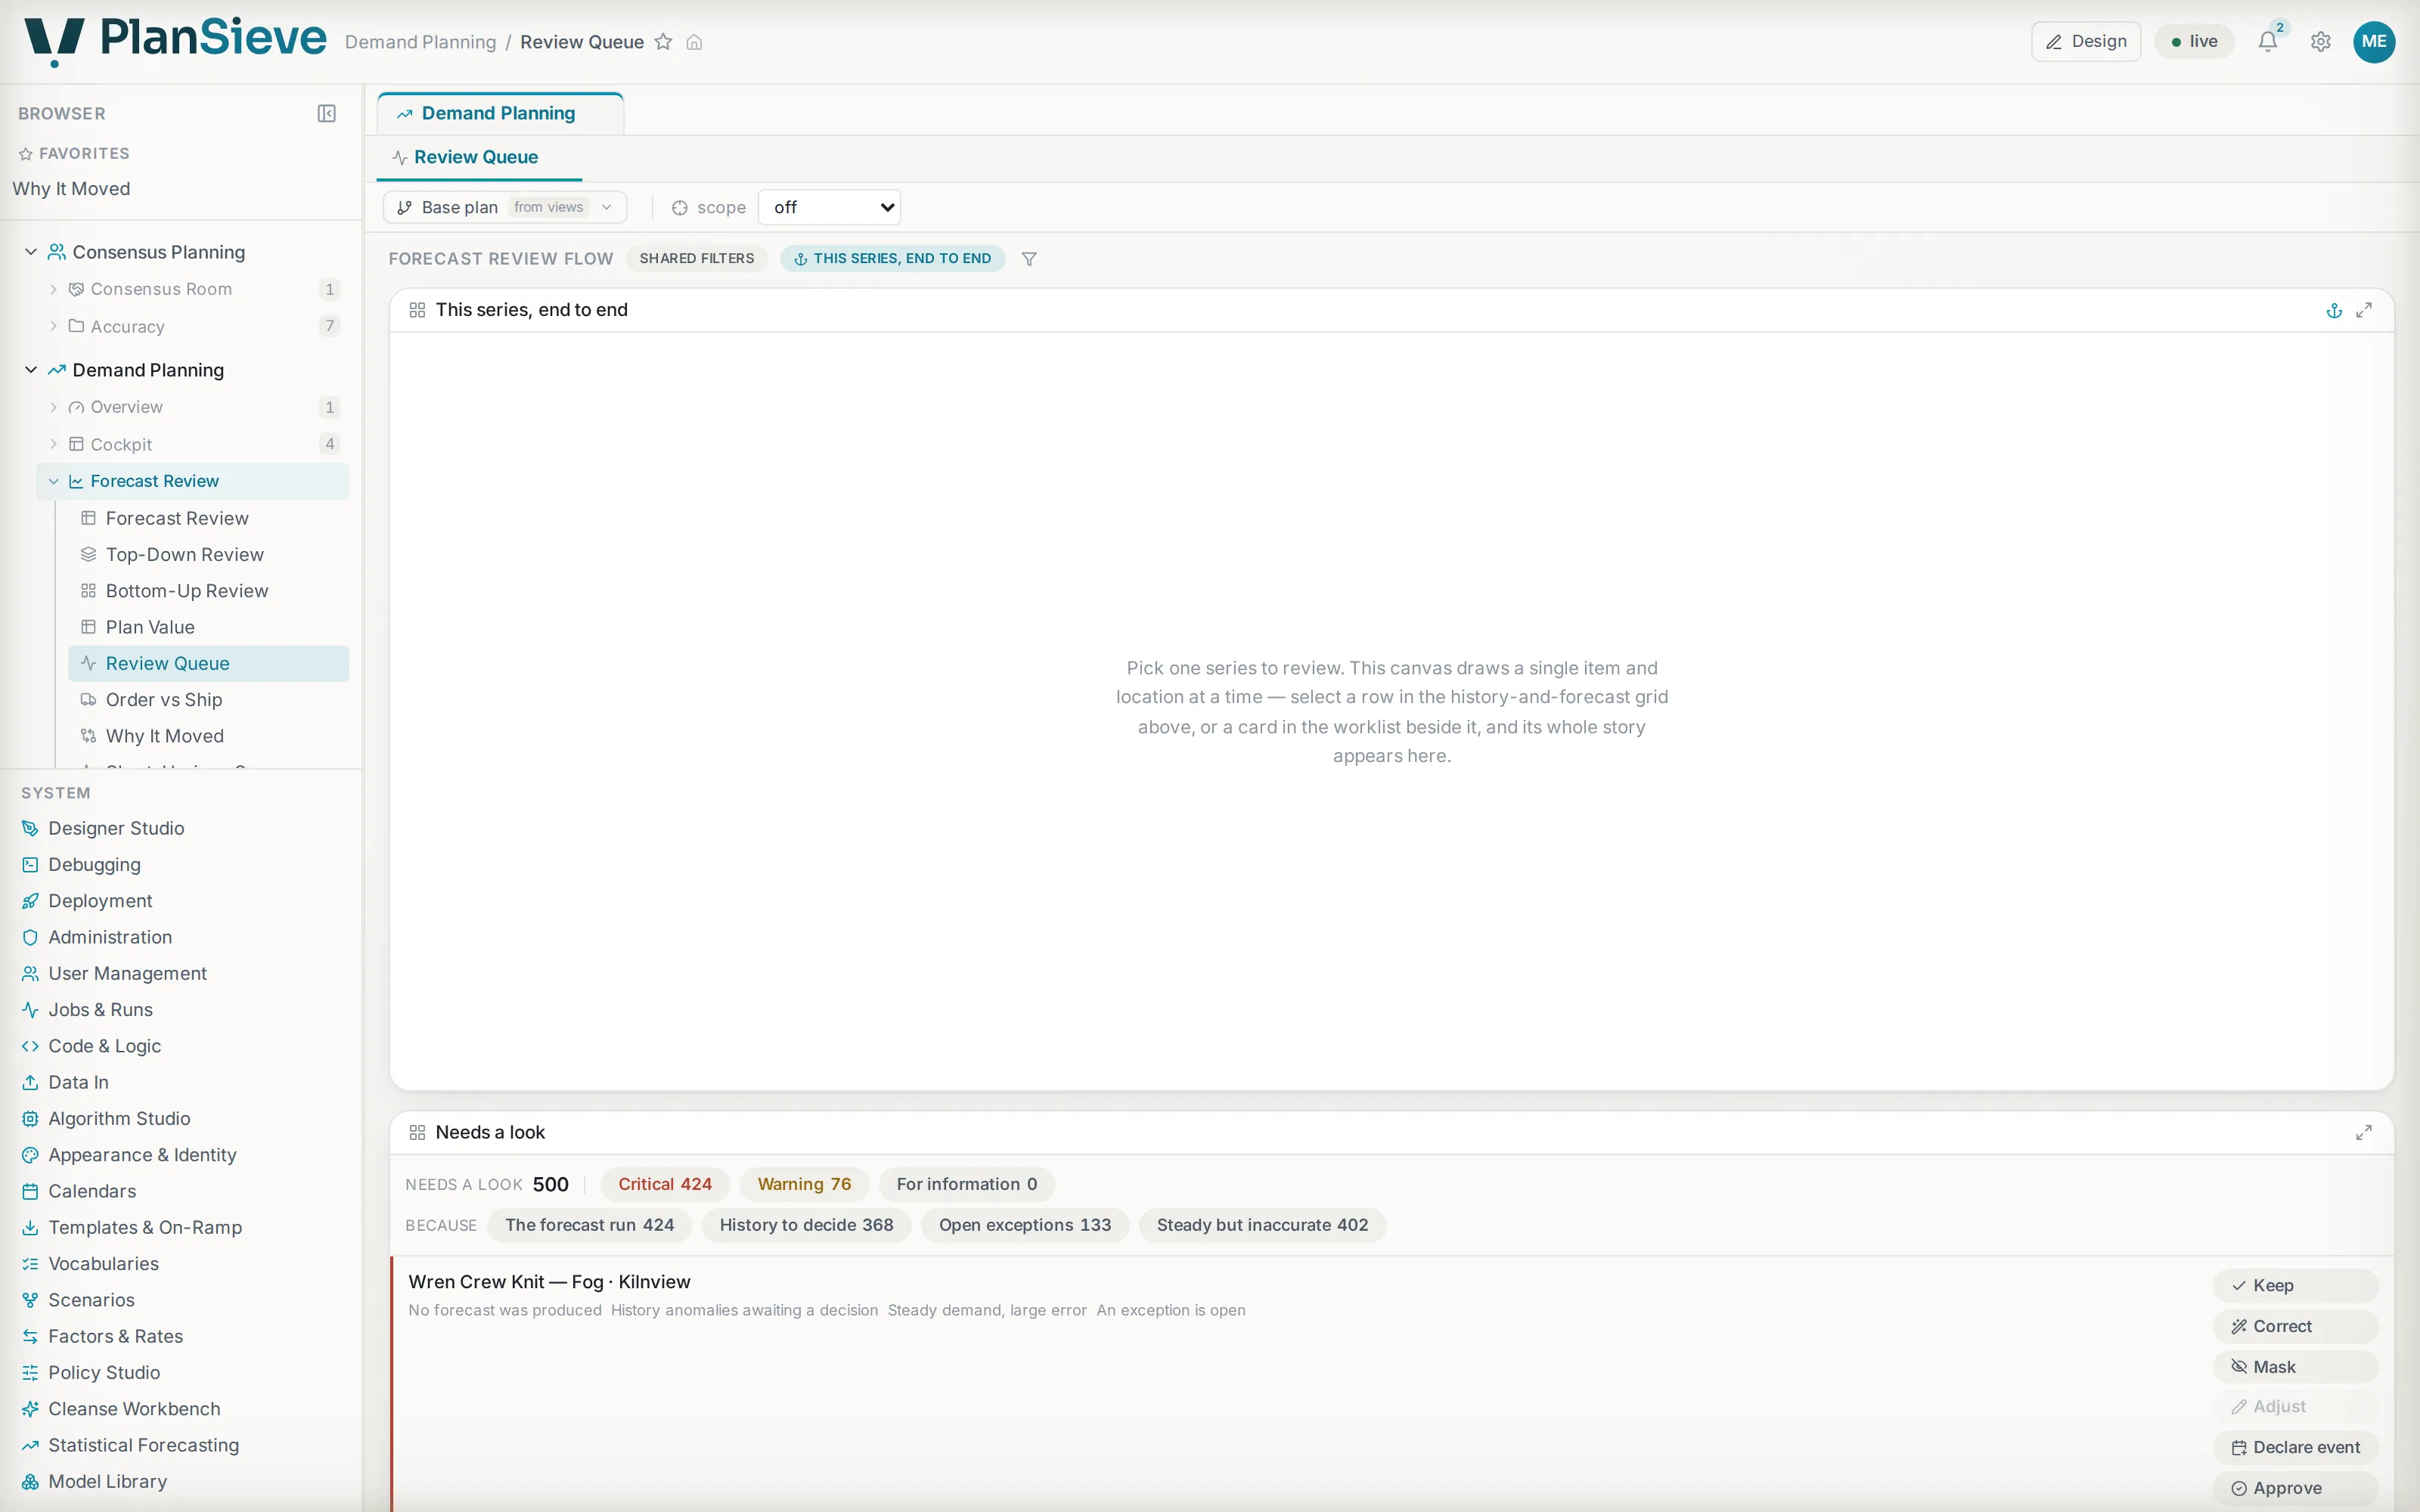
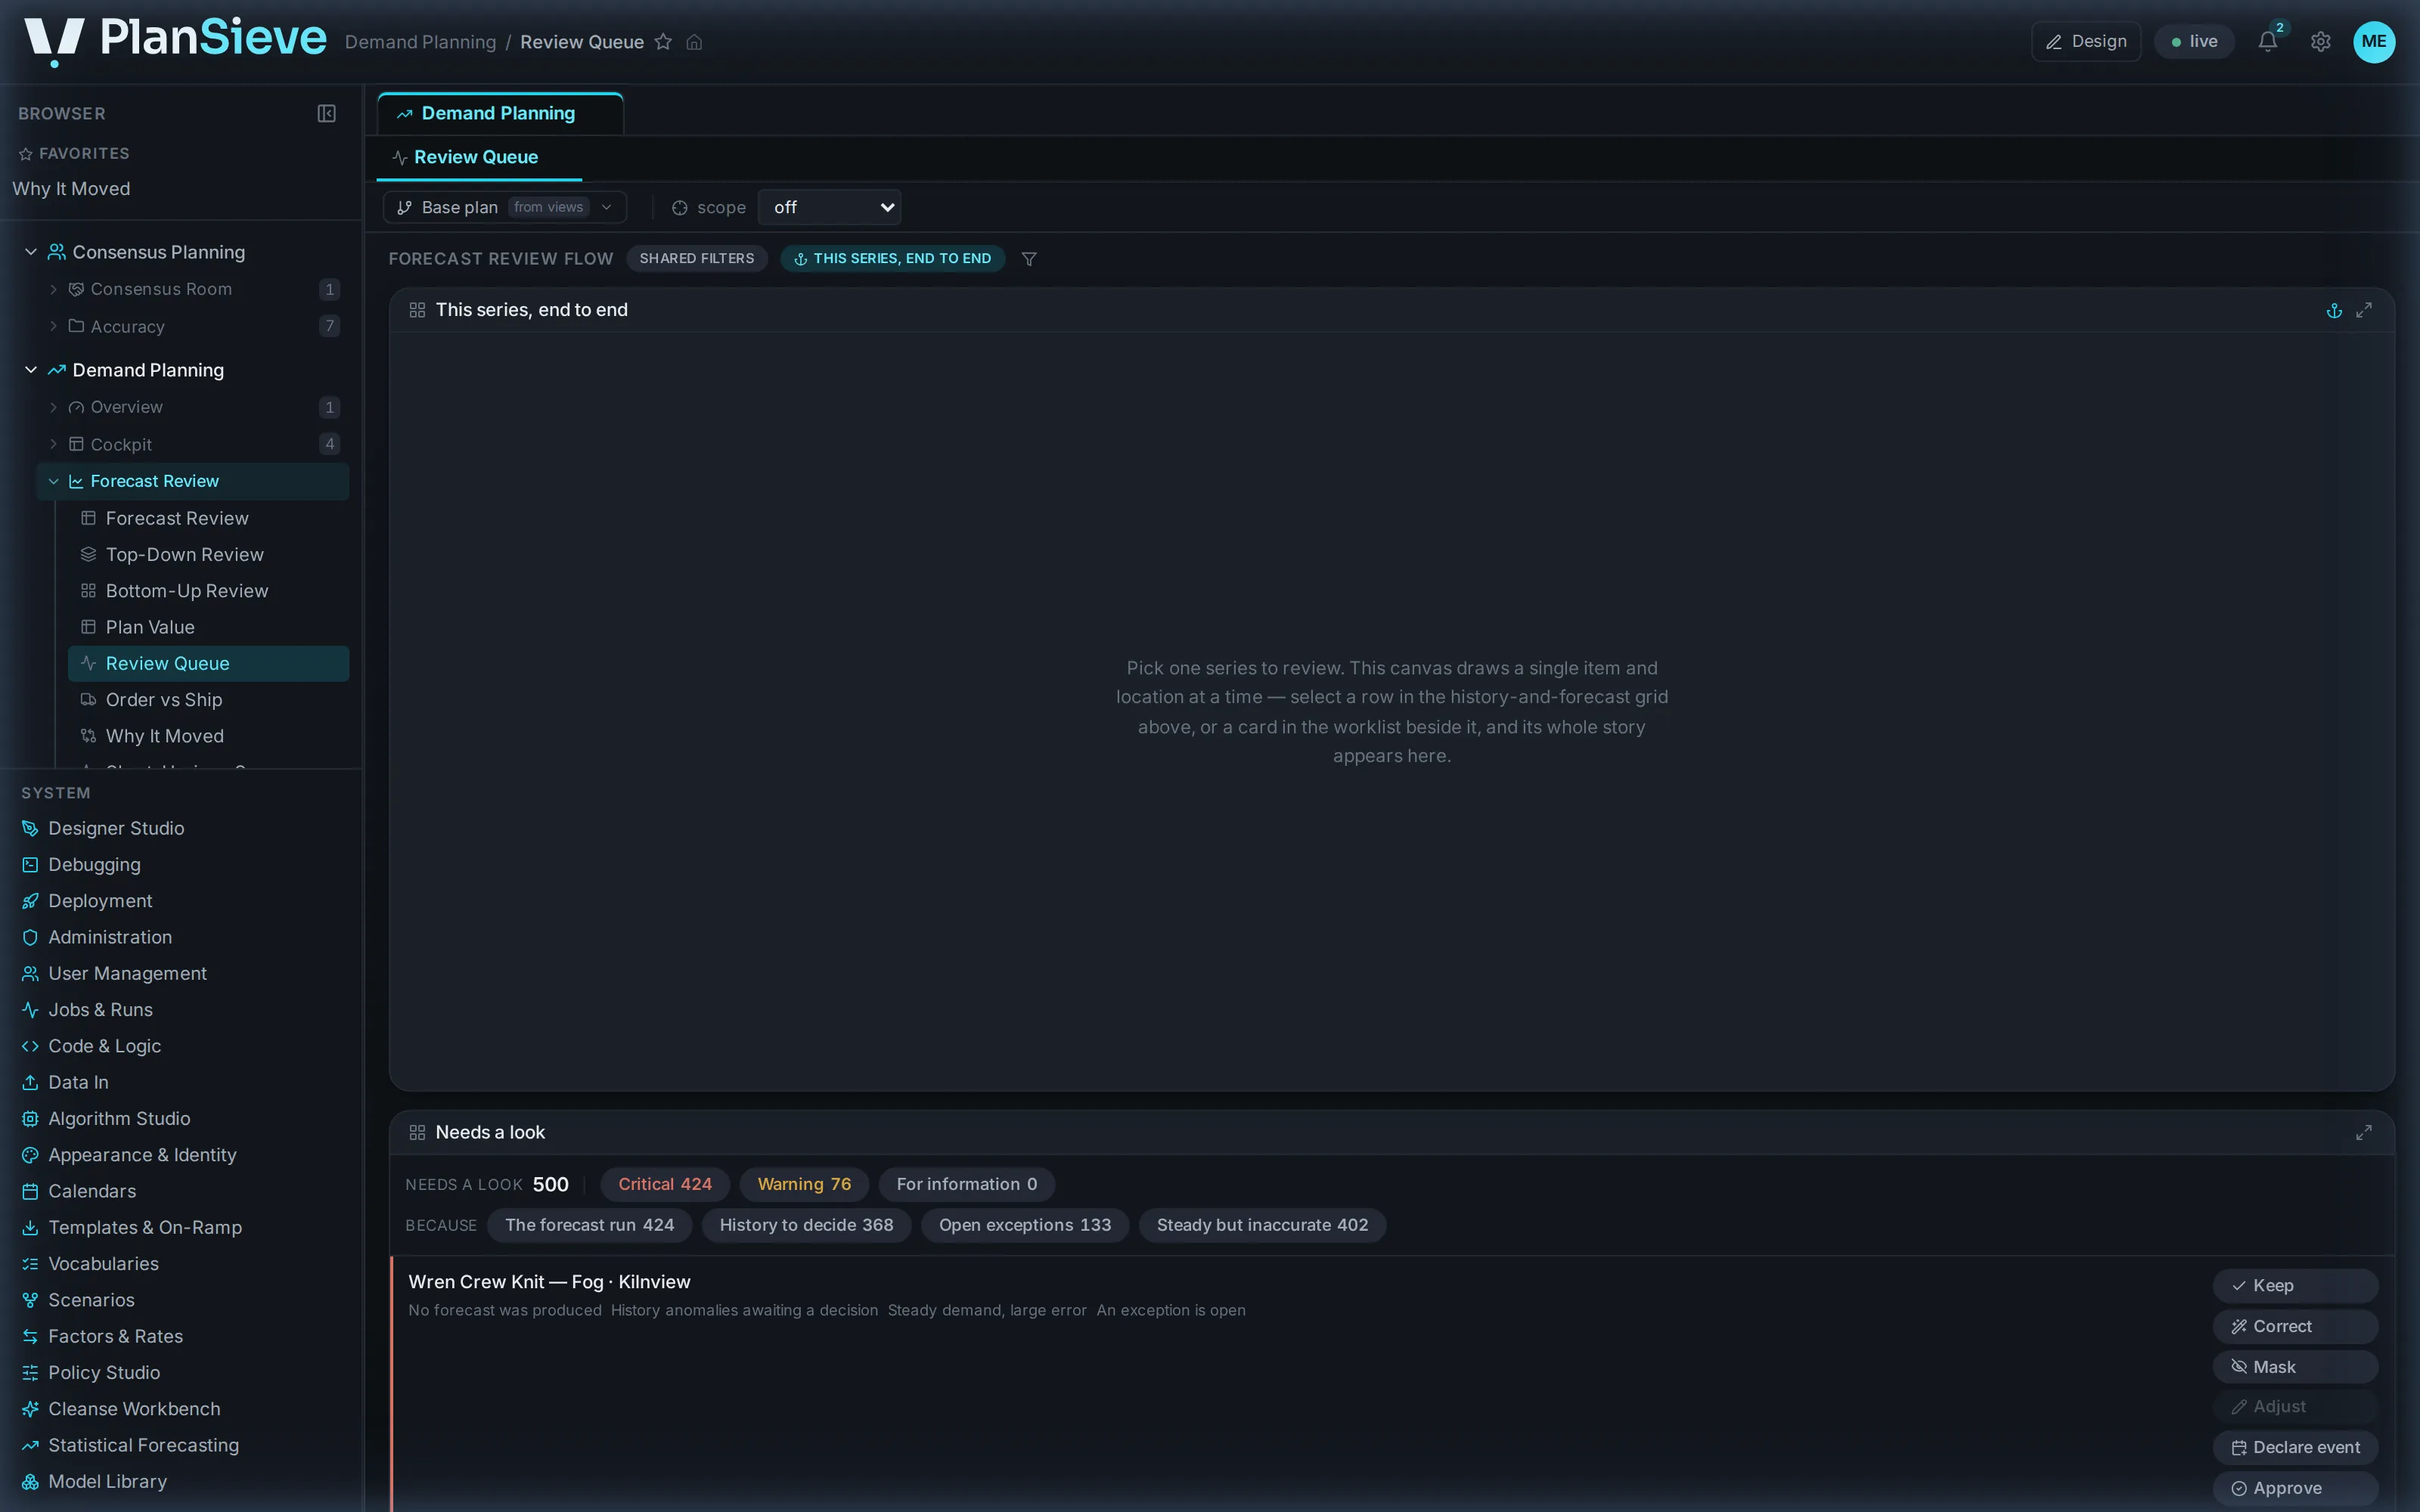
The morning starts with what needs a look, worst first.
The queue ranks the series that need a decision and says why: a spike, a stockout, a declared event, a model that lost its margin. So the day begins with the exceptions, not with a spreadsheet.
Every row carries its reason and its verbs, so a planner never leaves the queue to act on it. The queue hears the page filter exactly the way the grid beside it does, one filter grammar, not a private one, so “my categories, this quarter, the North region” narrows the worklist and the worksheet together.
The ranking is data, not a rendering: the same measures that put a series at the top are the ones the accuracy spine grades at the end of the cycle.


02 · The verdict
One gesture, and the whole plan hears you.
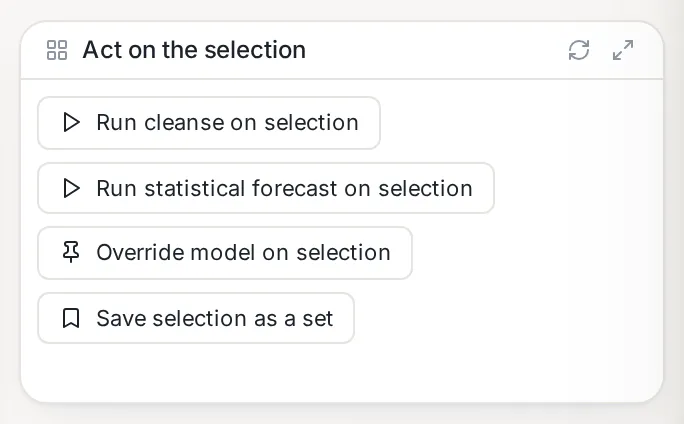
Keep it, correct it, mask it, name it as an event, adjust it or approve it, each a single click with the evidence sitting beside it.
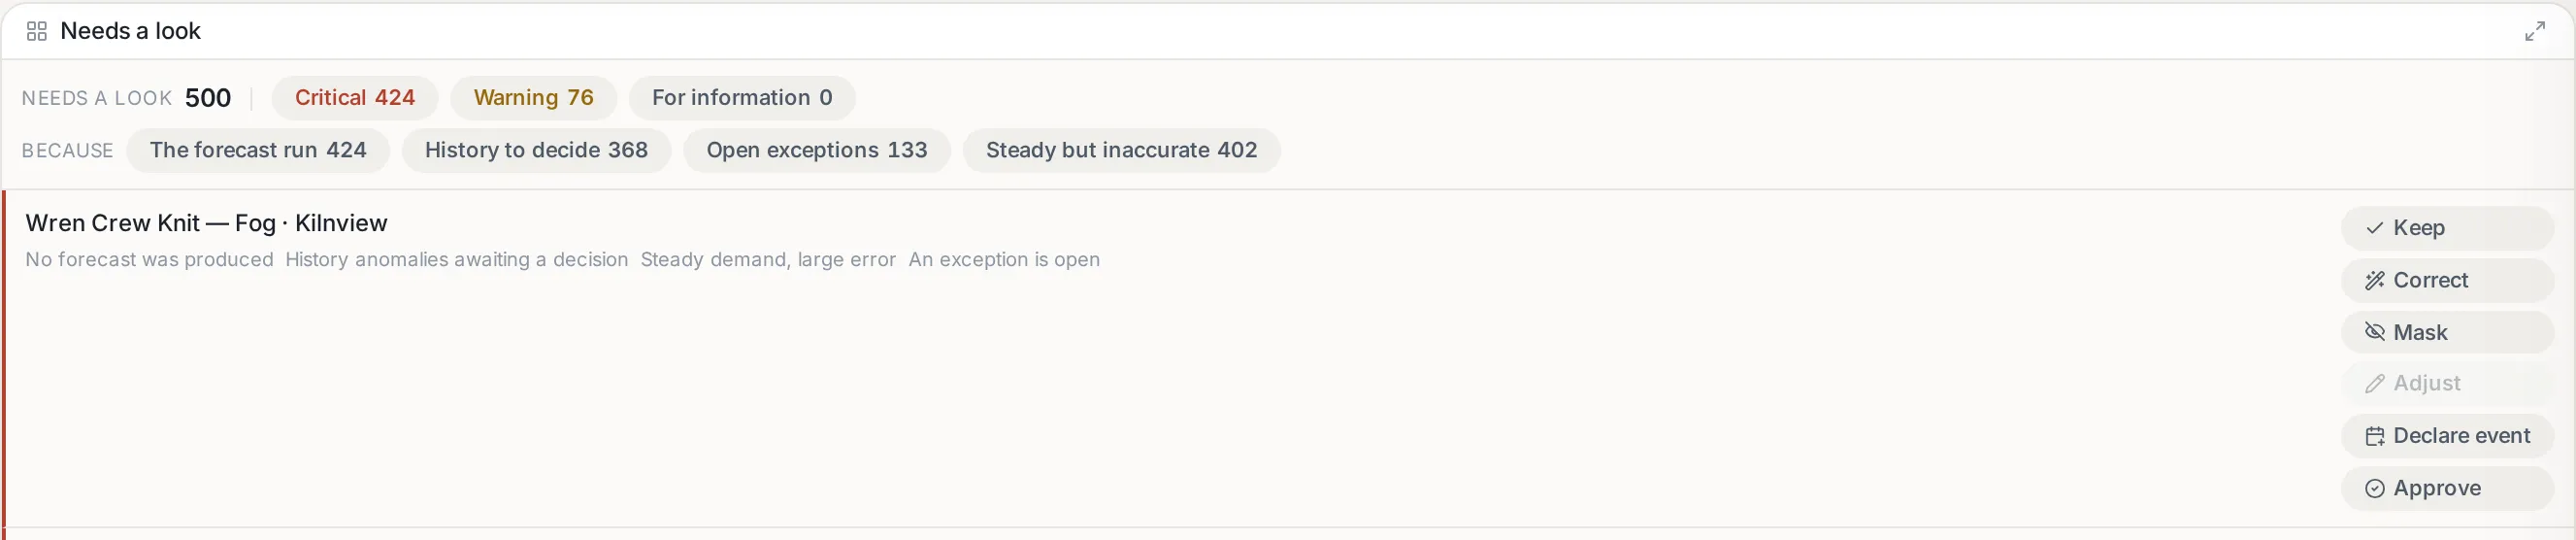
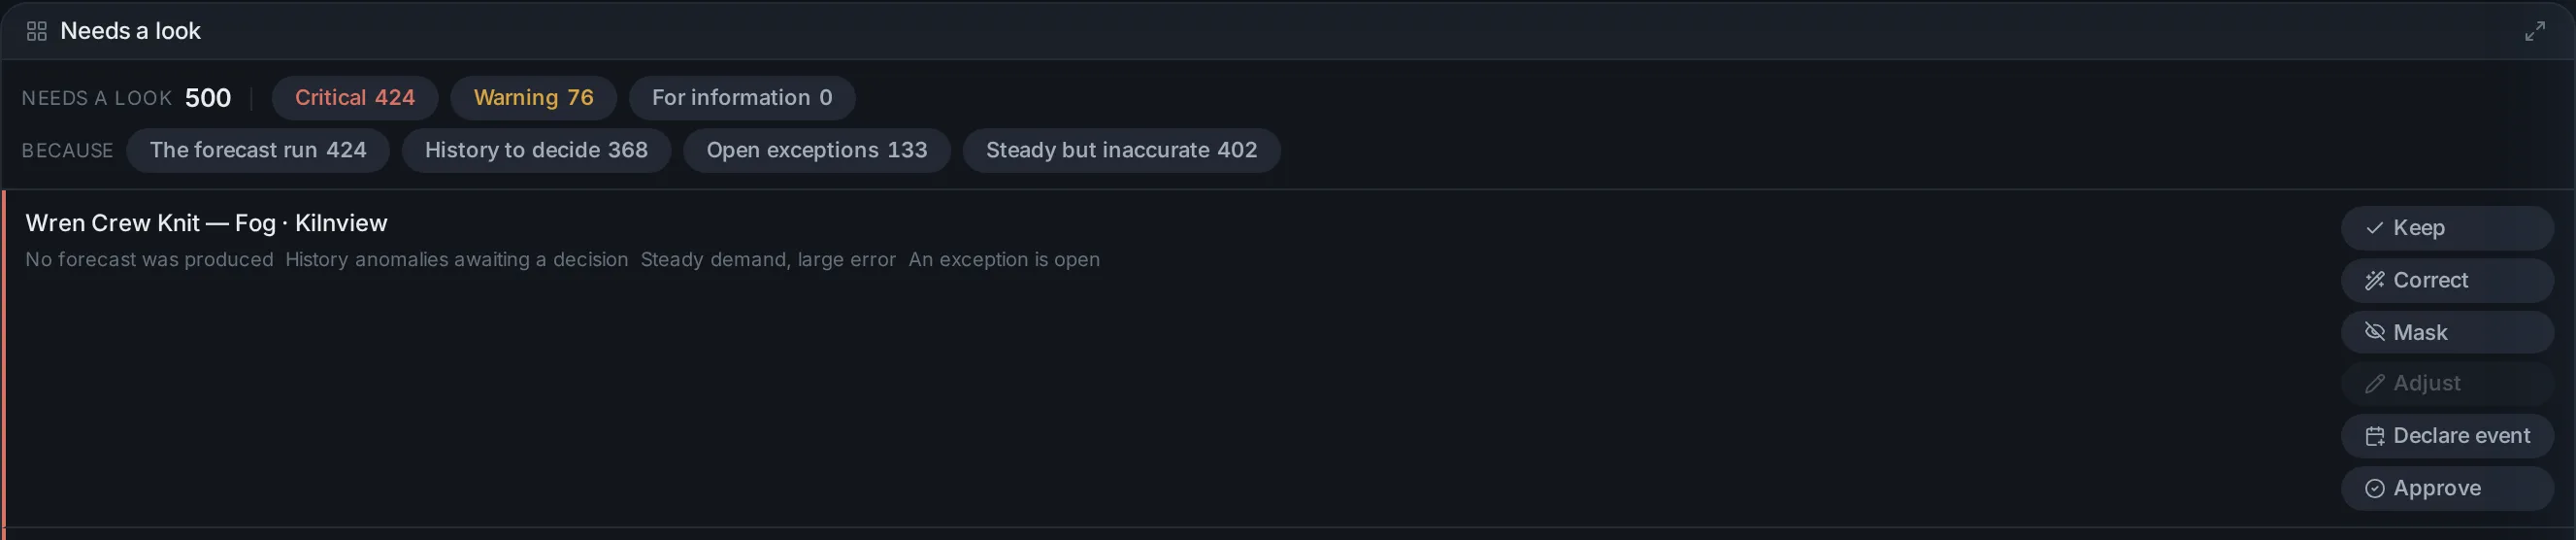
The verdict is stored as data, not as a note. It lands as measures on the history itself, through the ordinary edit door, with a governed reason beside it and a vintage stamp that makes leakage-free replay possible, so the cleansing engine, the model contest and the next cycle all read it. Judgement stops being an override the system fights and becomes an input the system uses.
Declare event is the verb the category forgets: an observed spike becomes a named, dated, reusable event rather than a number that gets erased. Any verdict in at most two gestures, on one surface. That is the bar the module is built to.
03 · Explain
Every number can be asked why.
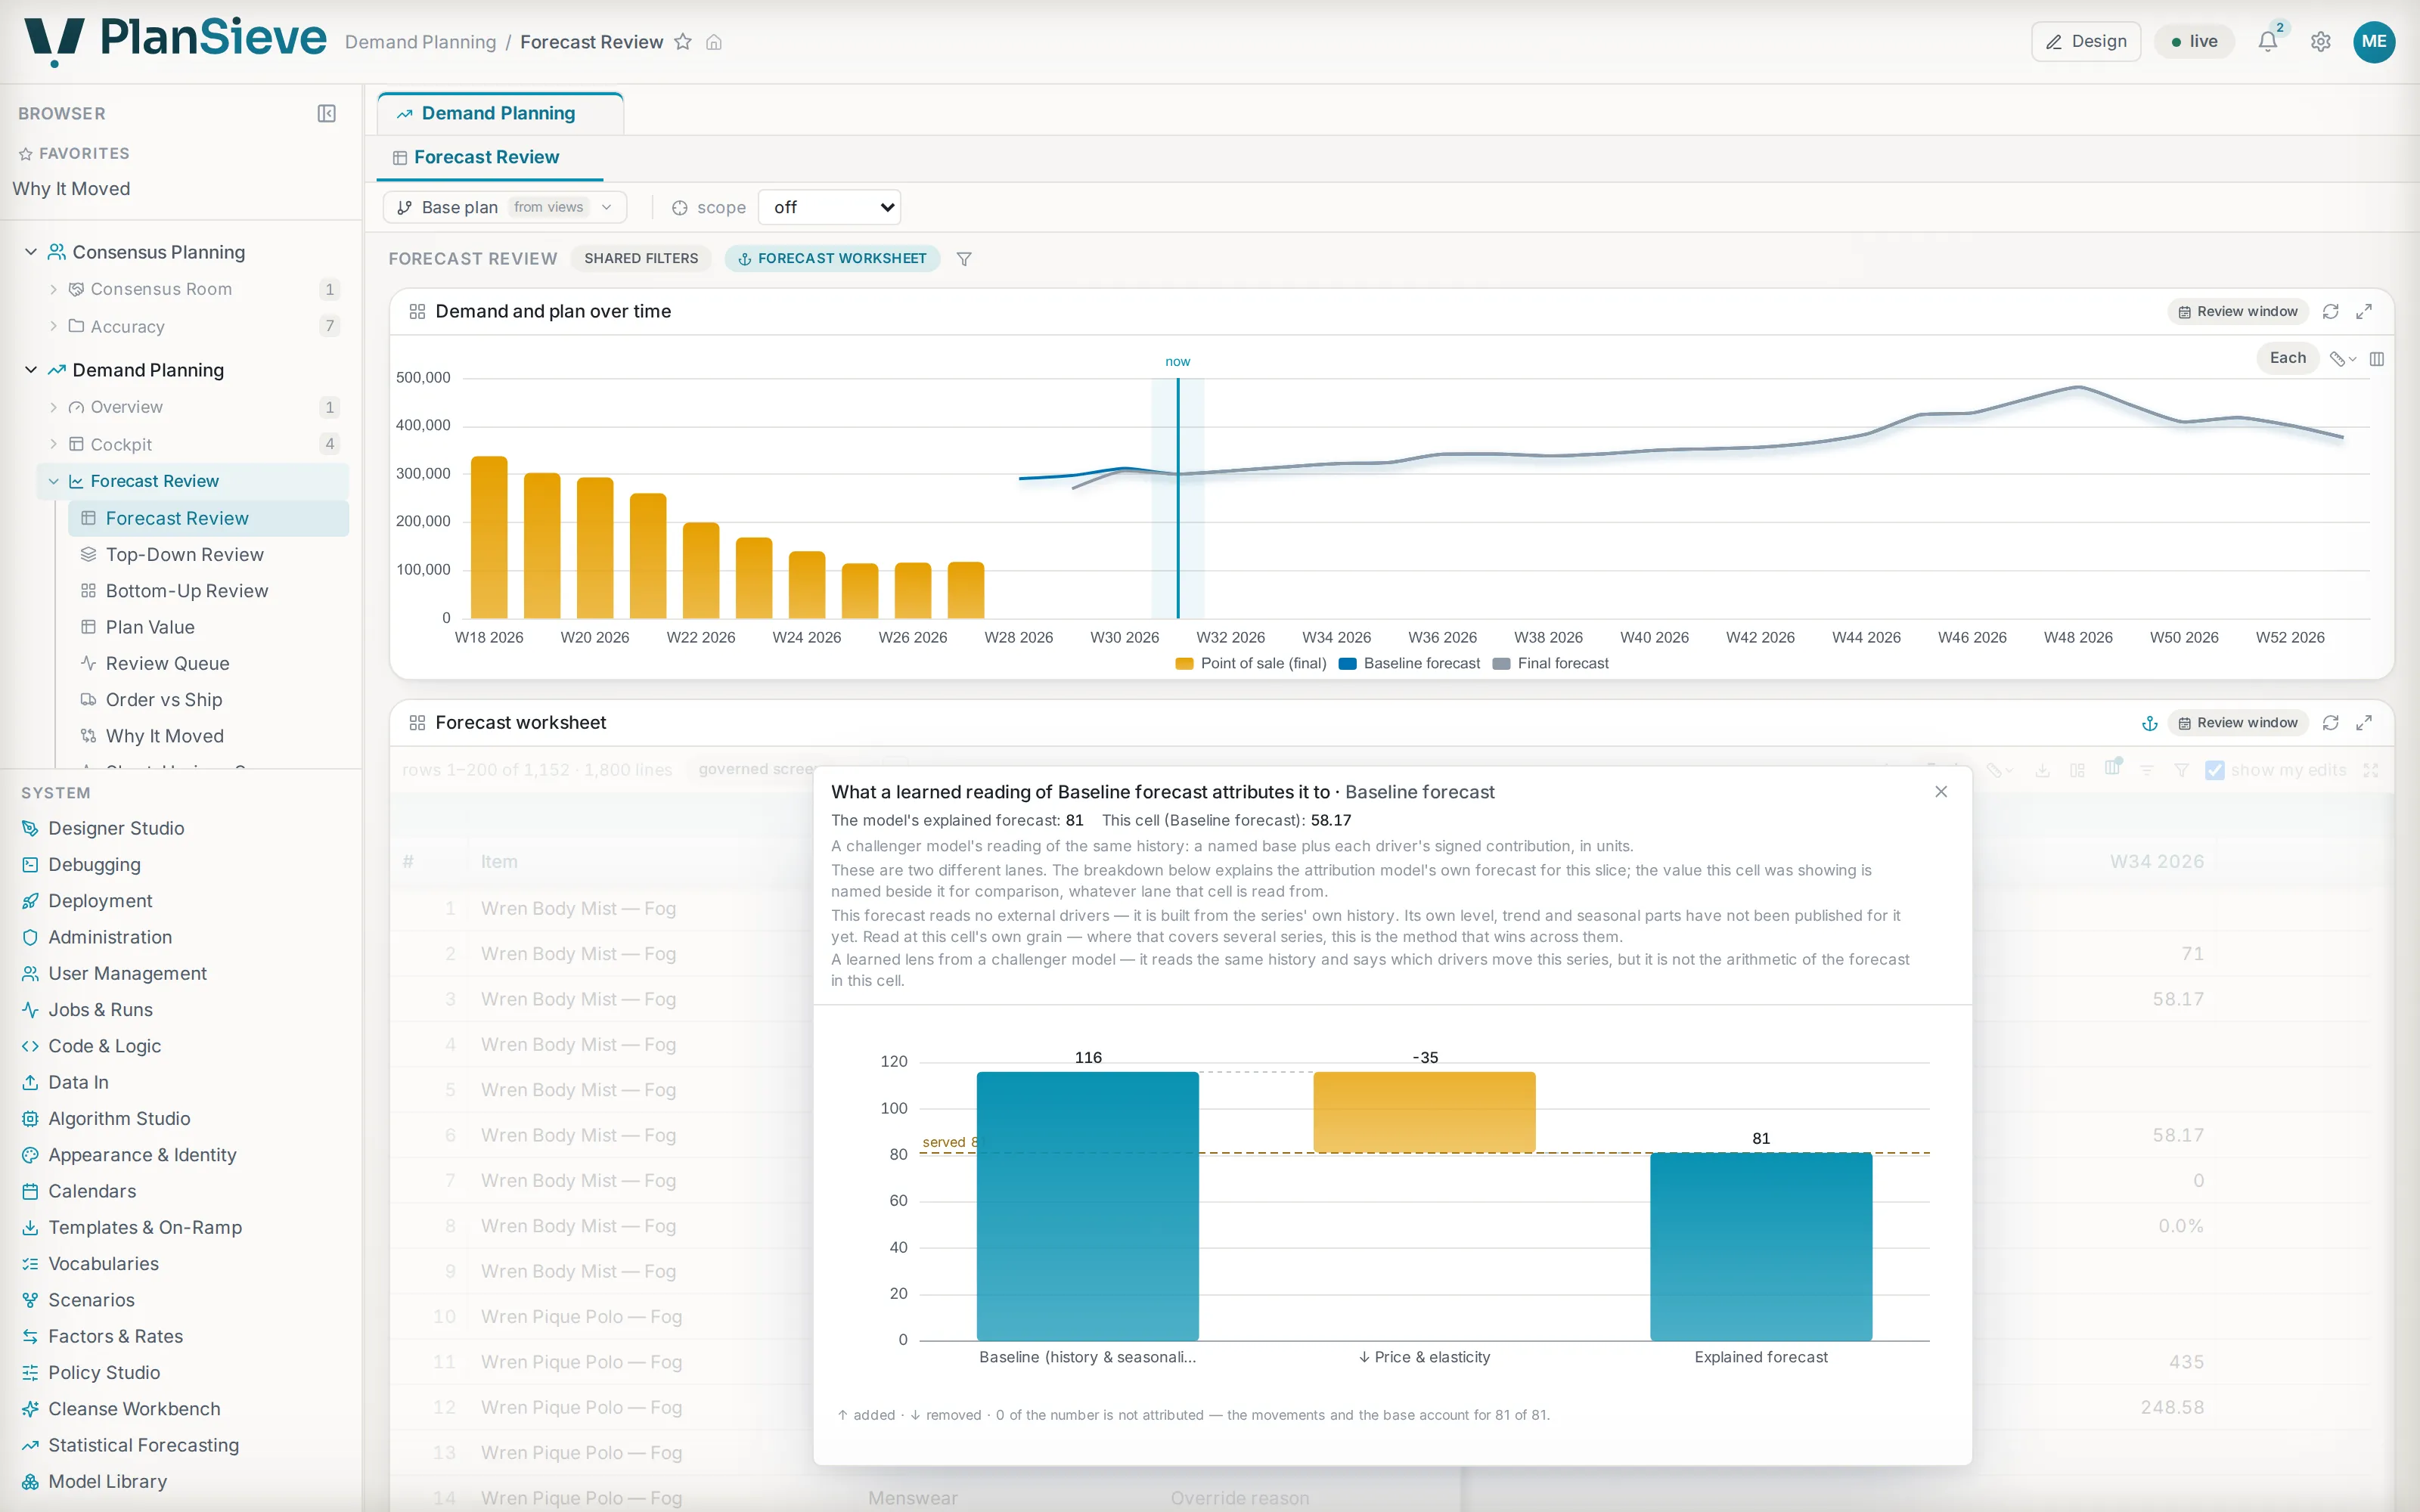
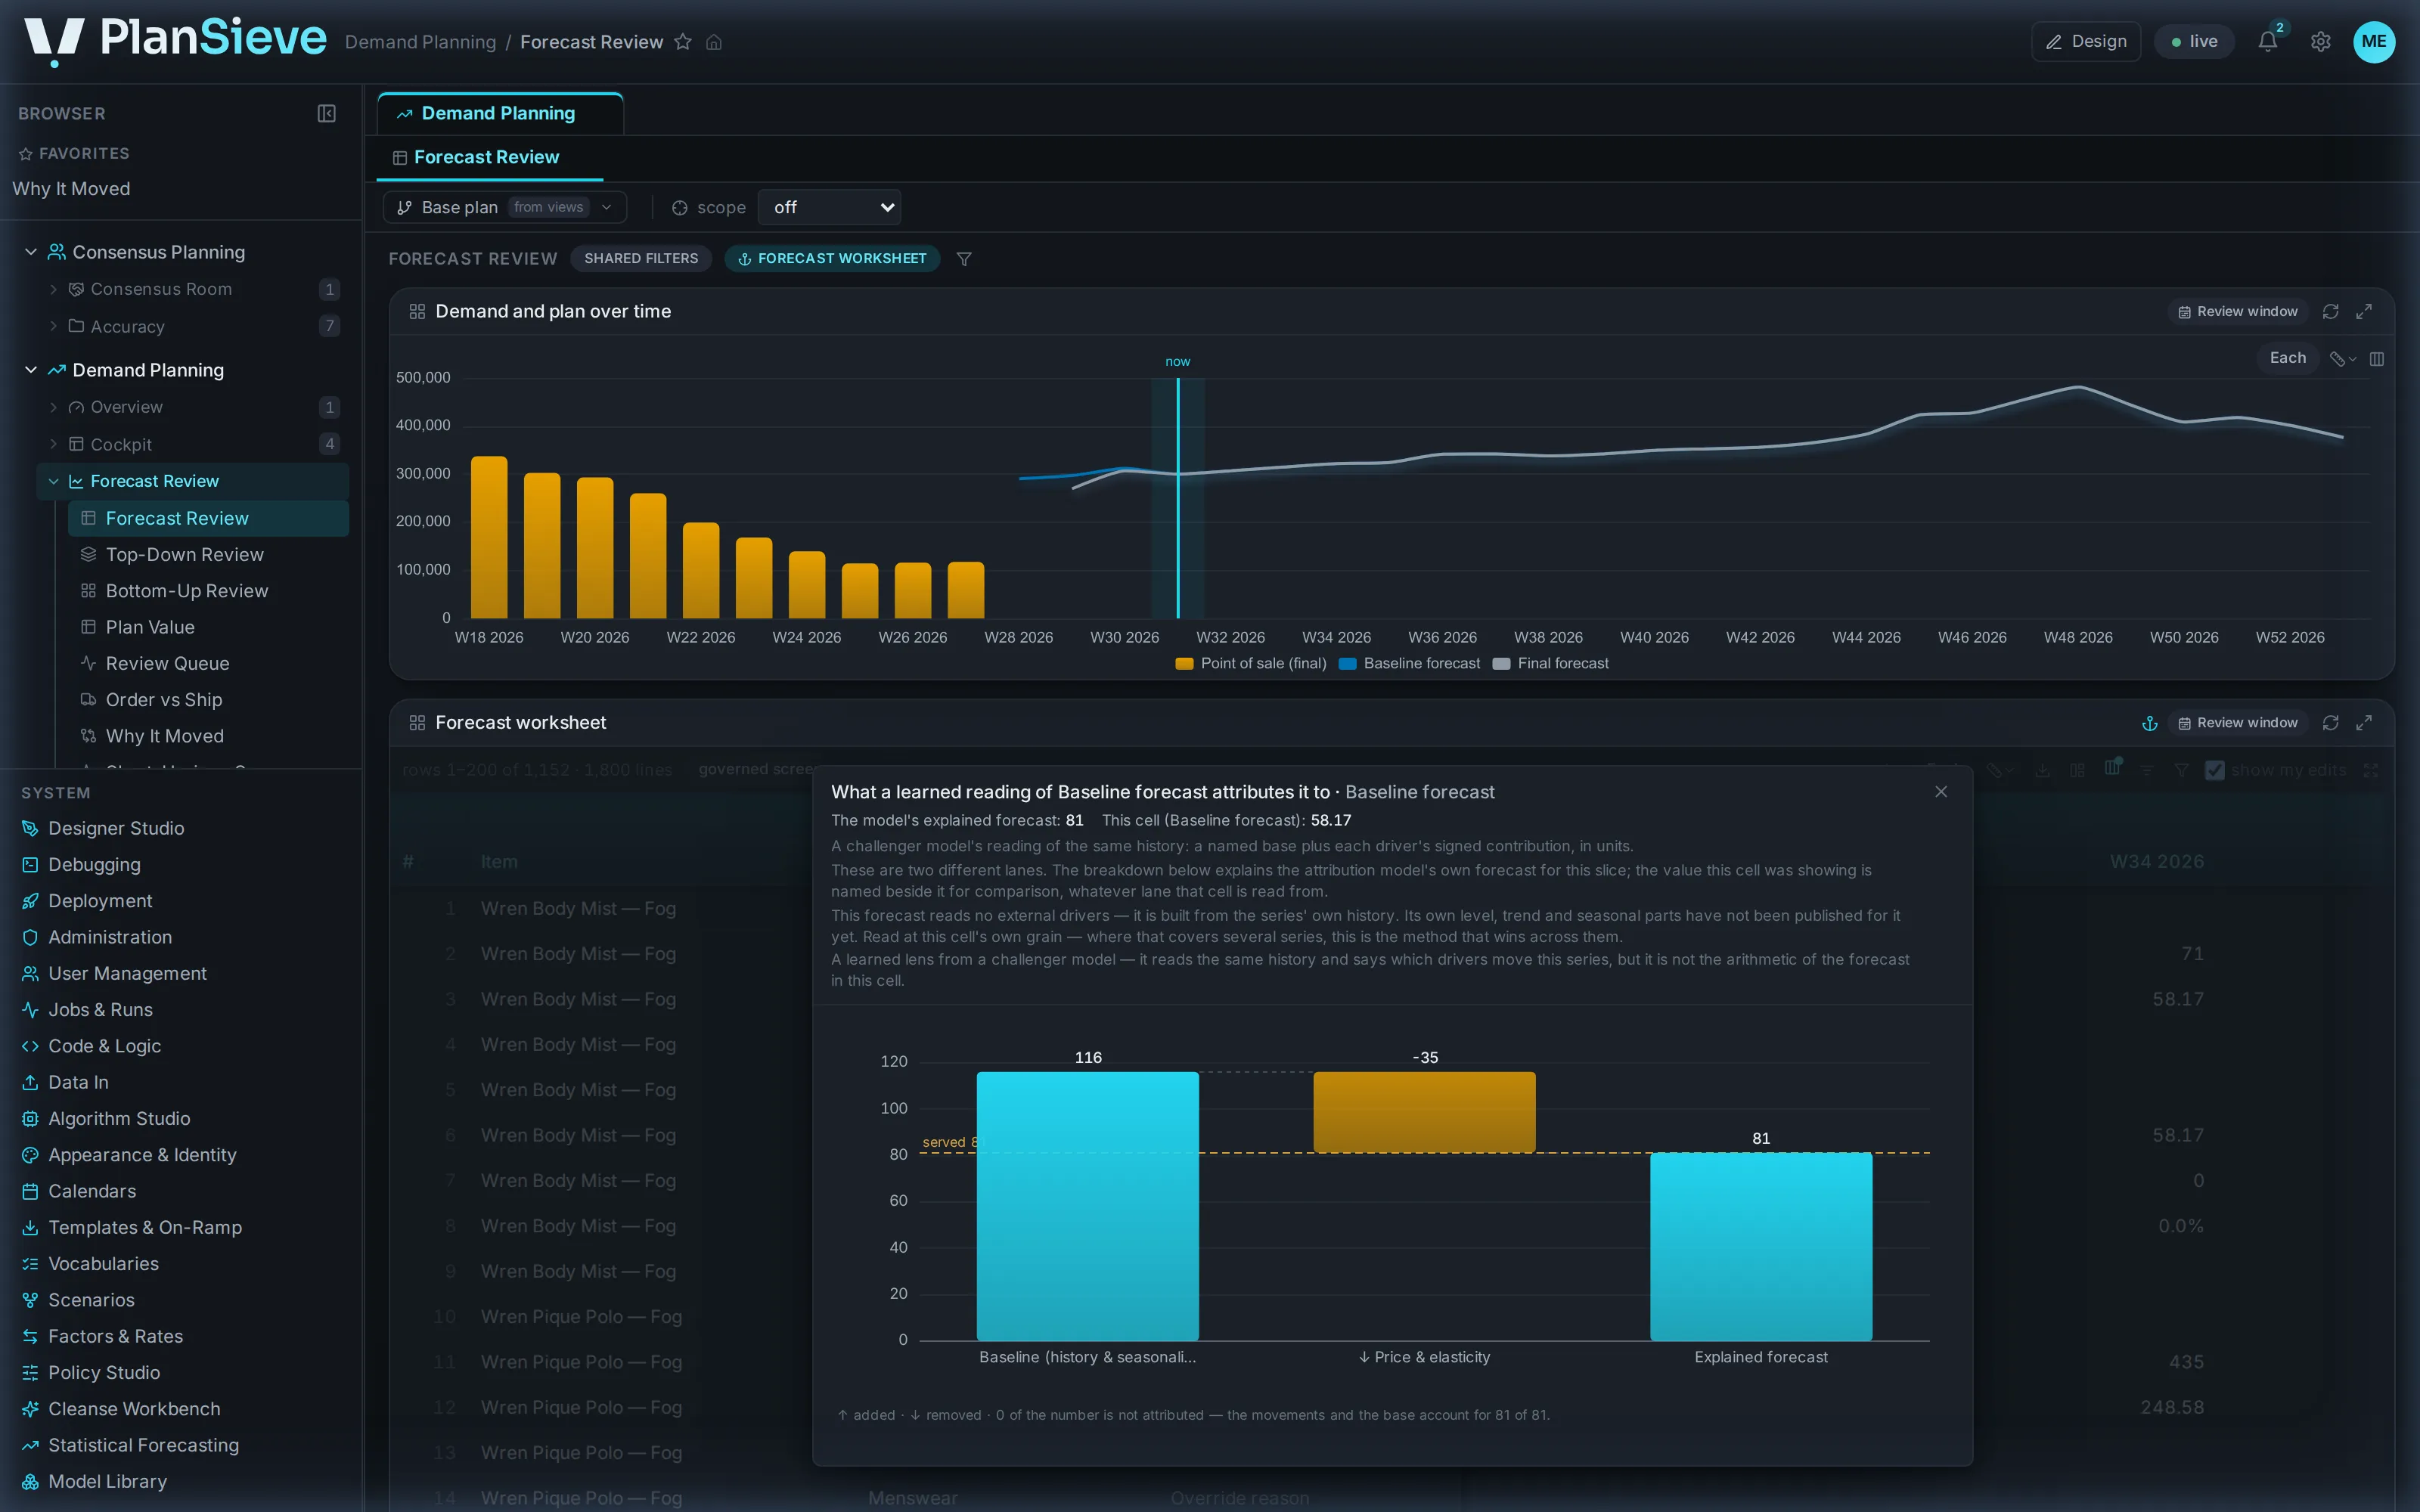
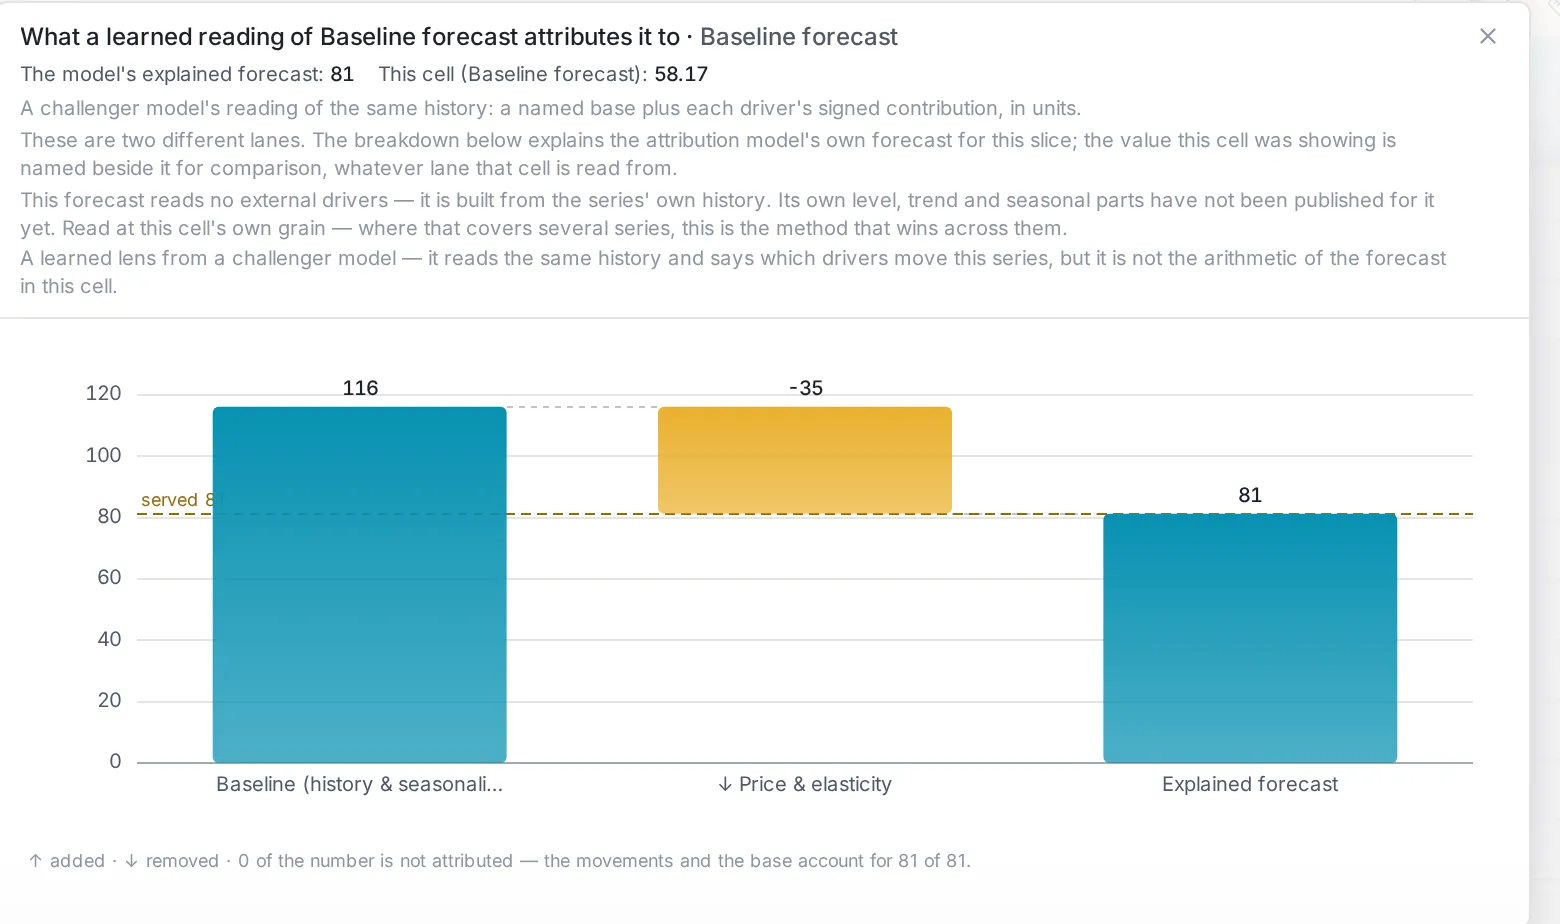
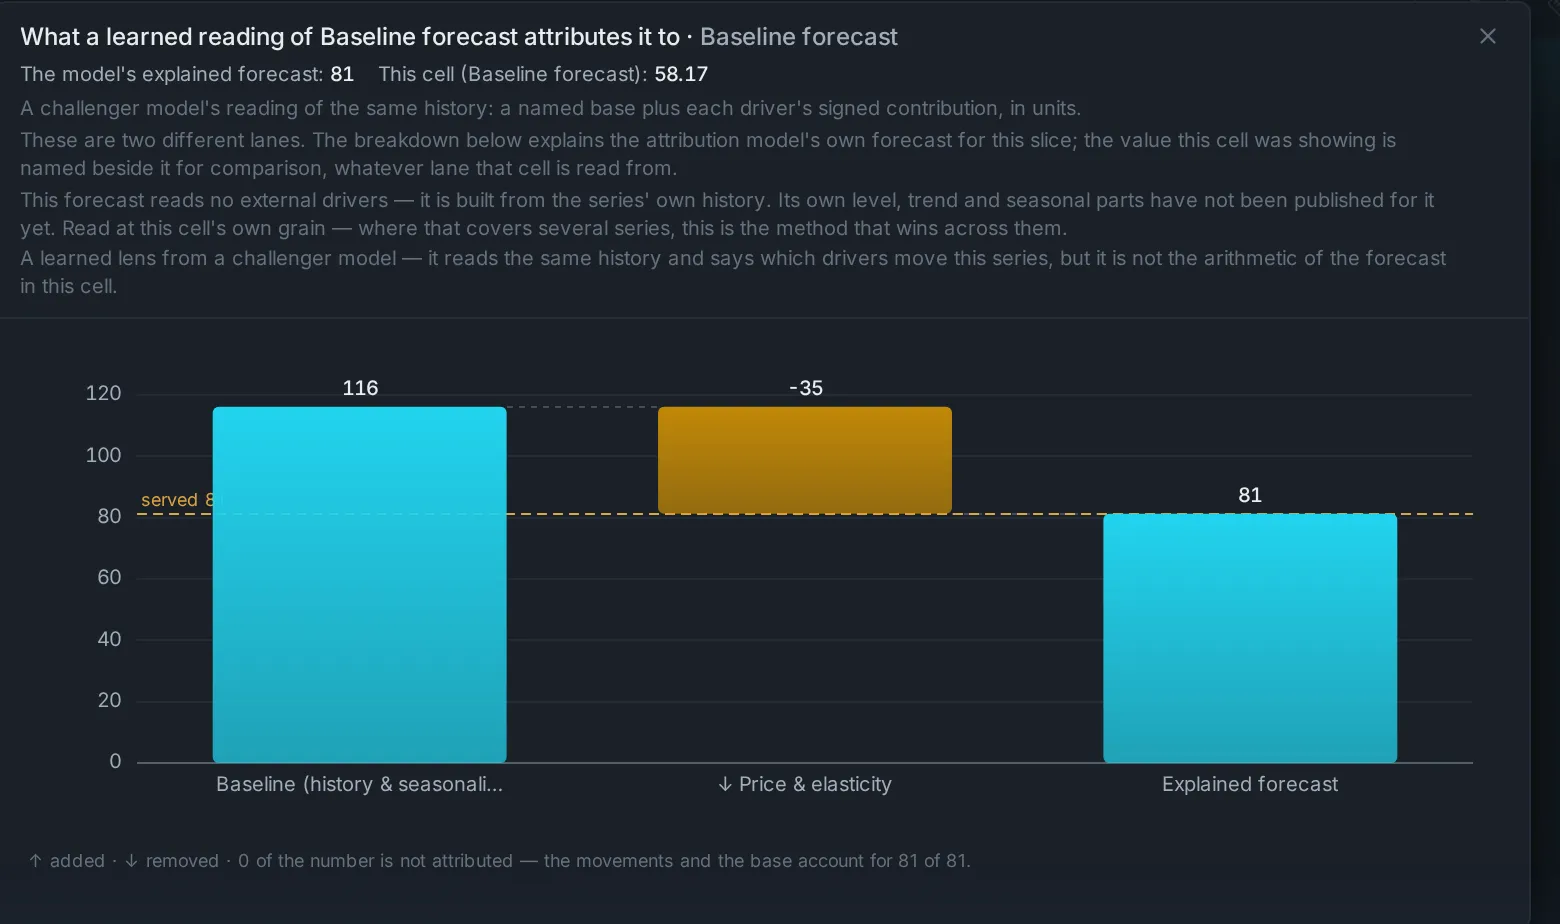
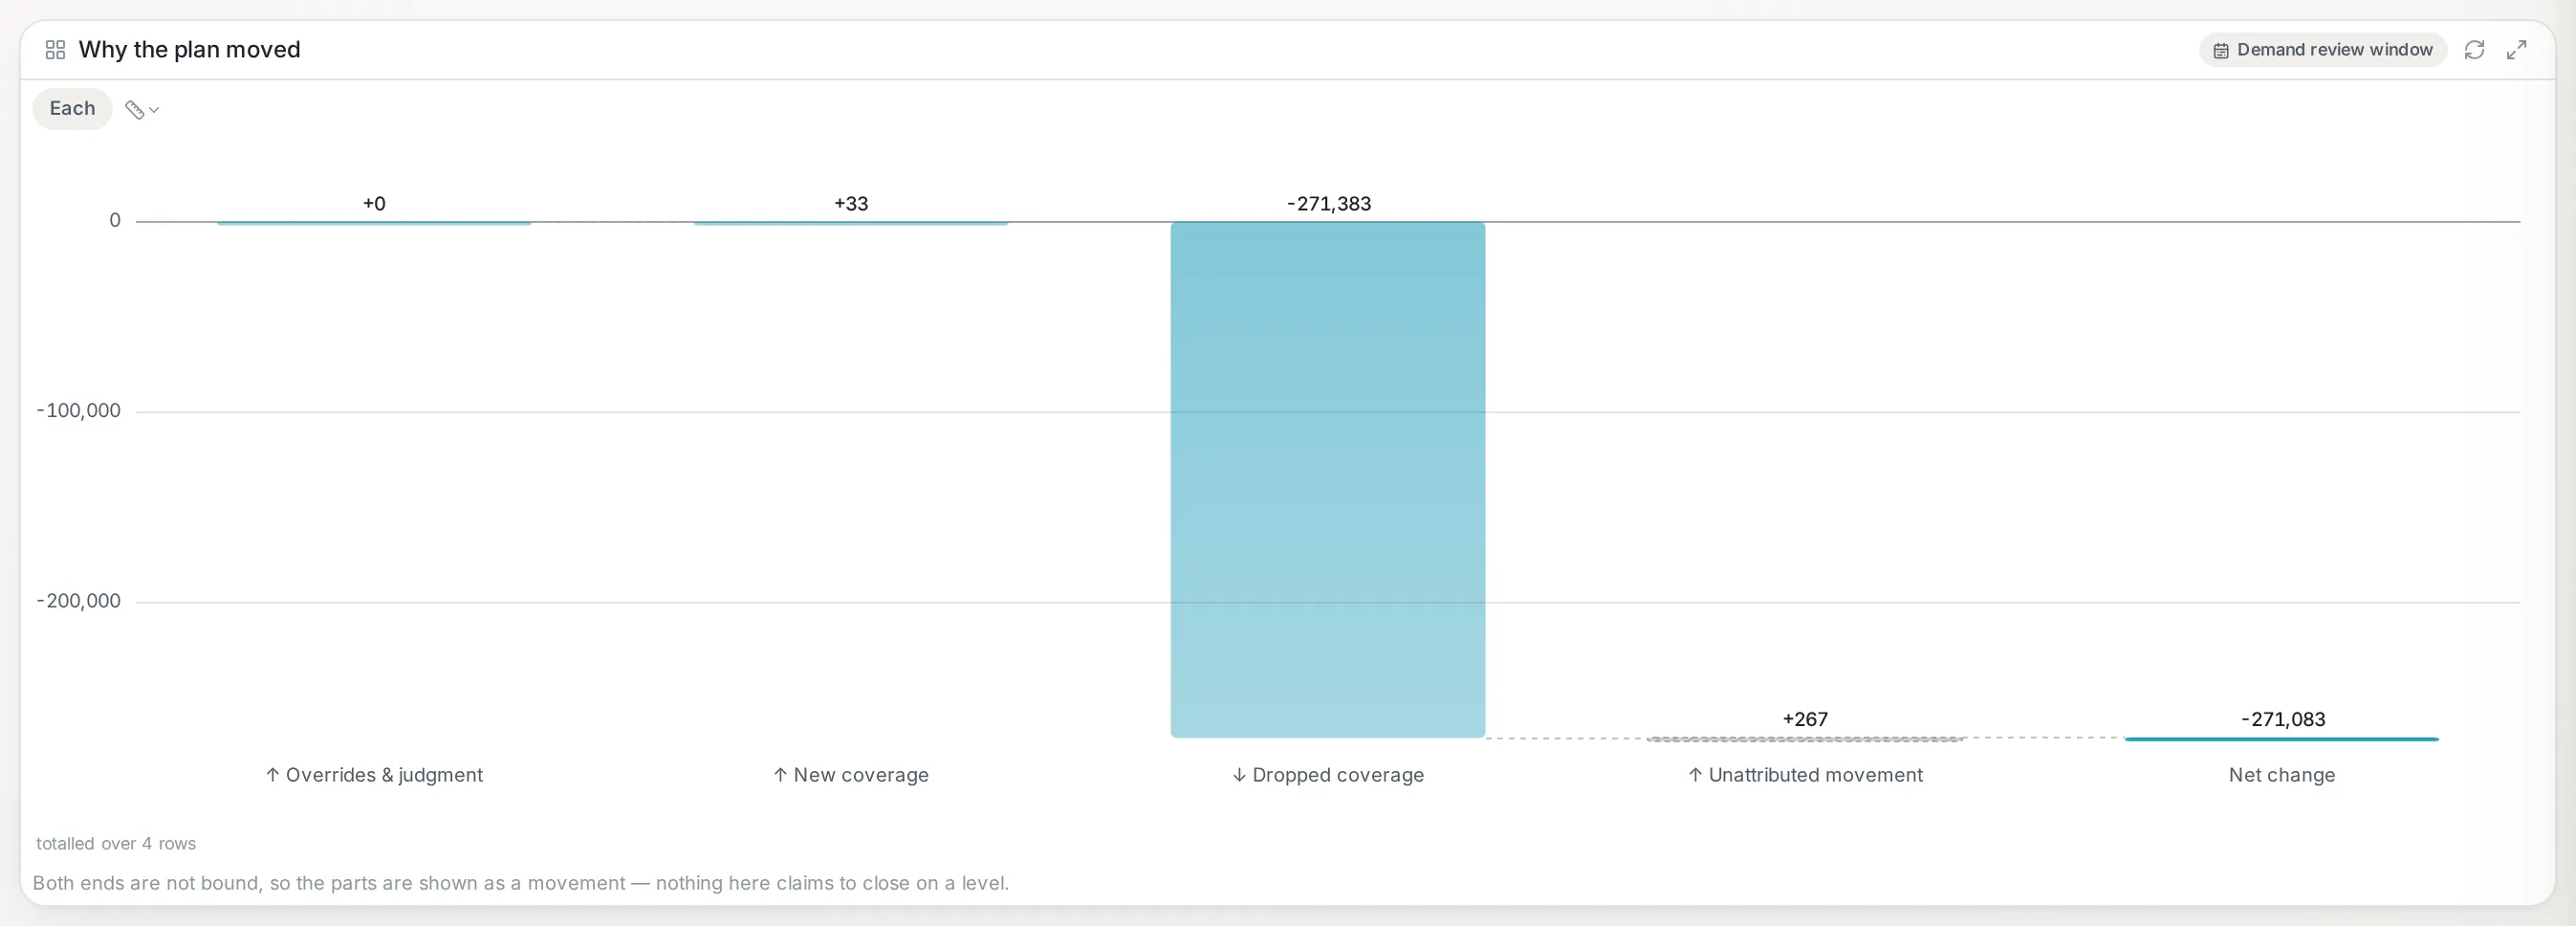
Right-click a forecast and see what built it: the base level, each driver’s push up or down, the model that won and the margin it won by, and what changed since the last cycle.
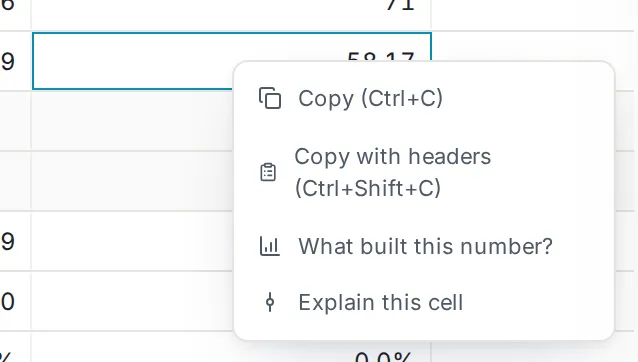
The explanation is of the number you clicked, always, declared by the rule that authored it, never inferred. Where the arithmetic is exact we draw the waterfall. Where it is a proportional share we say so in words instead of drawing one that would lie, and we tell you how much of an aggregate the breakdown actually stands on.
The same permissions that wall the grid wall the explanation, so it is never a side channel around who may see what.
We let the model say no.
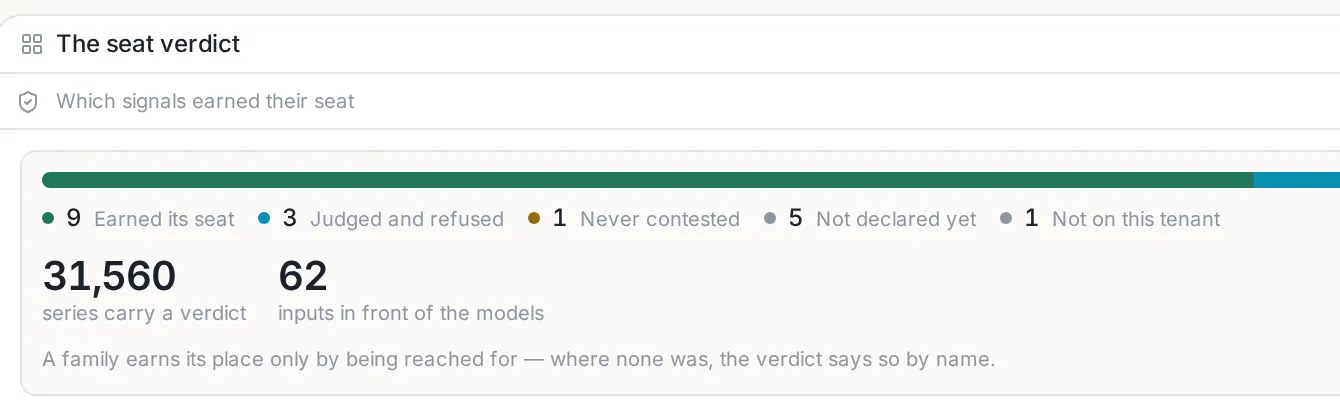
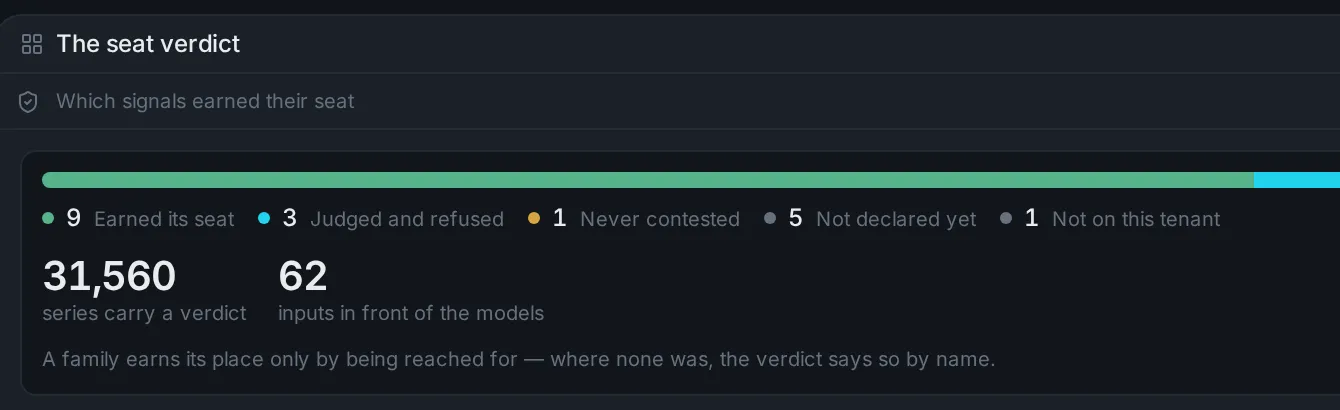
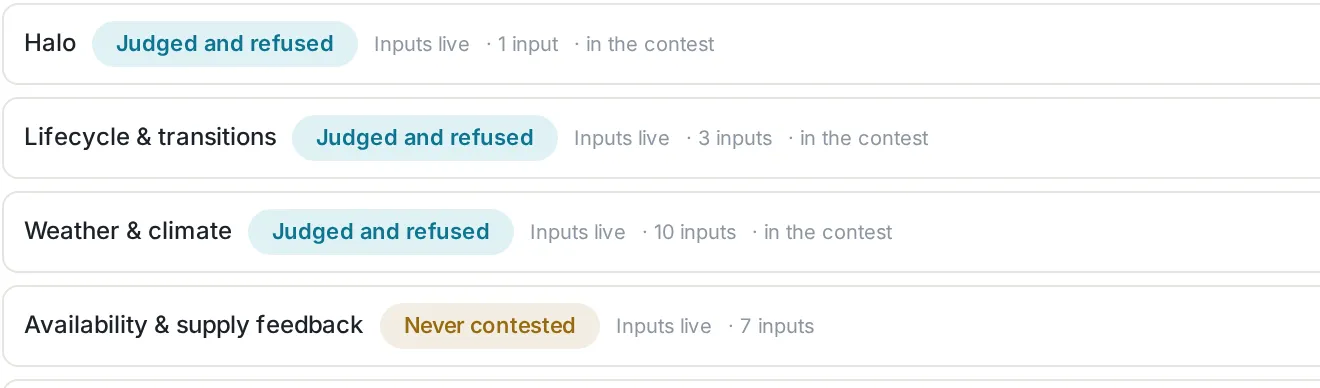
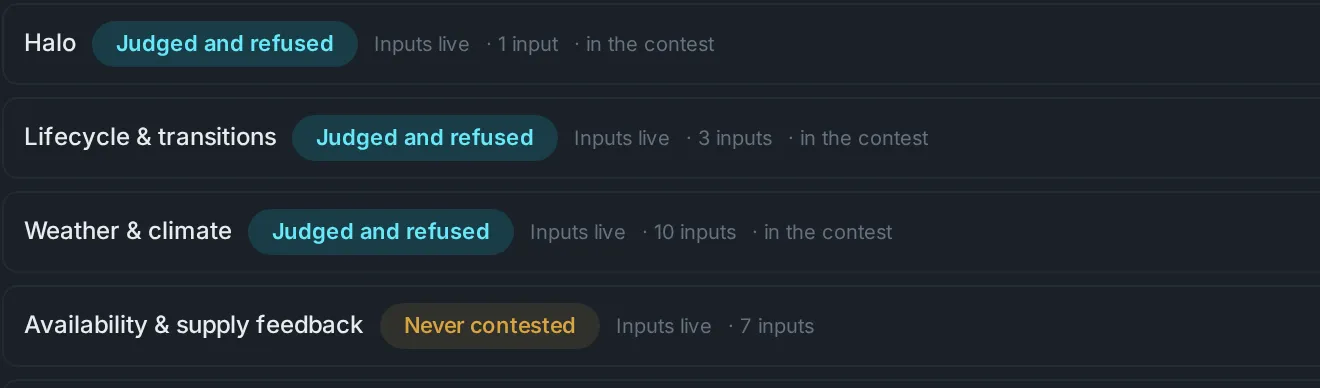
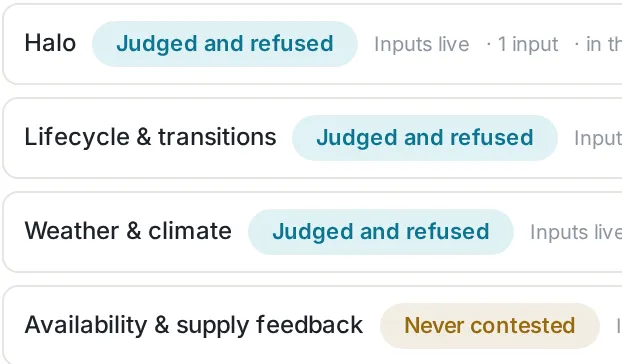
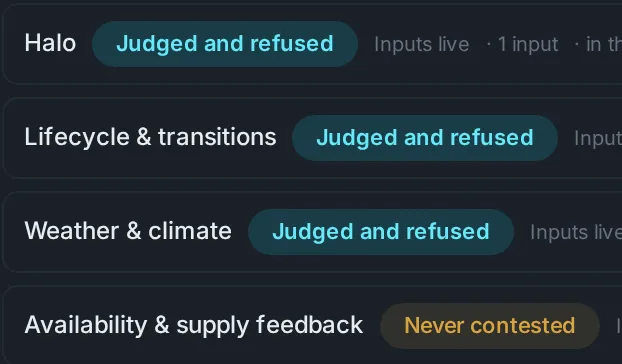
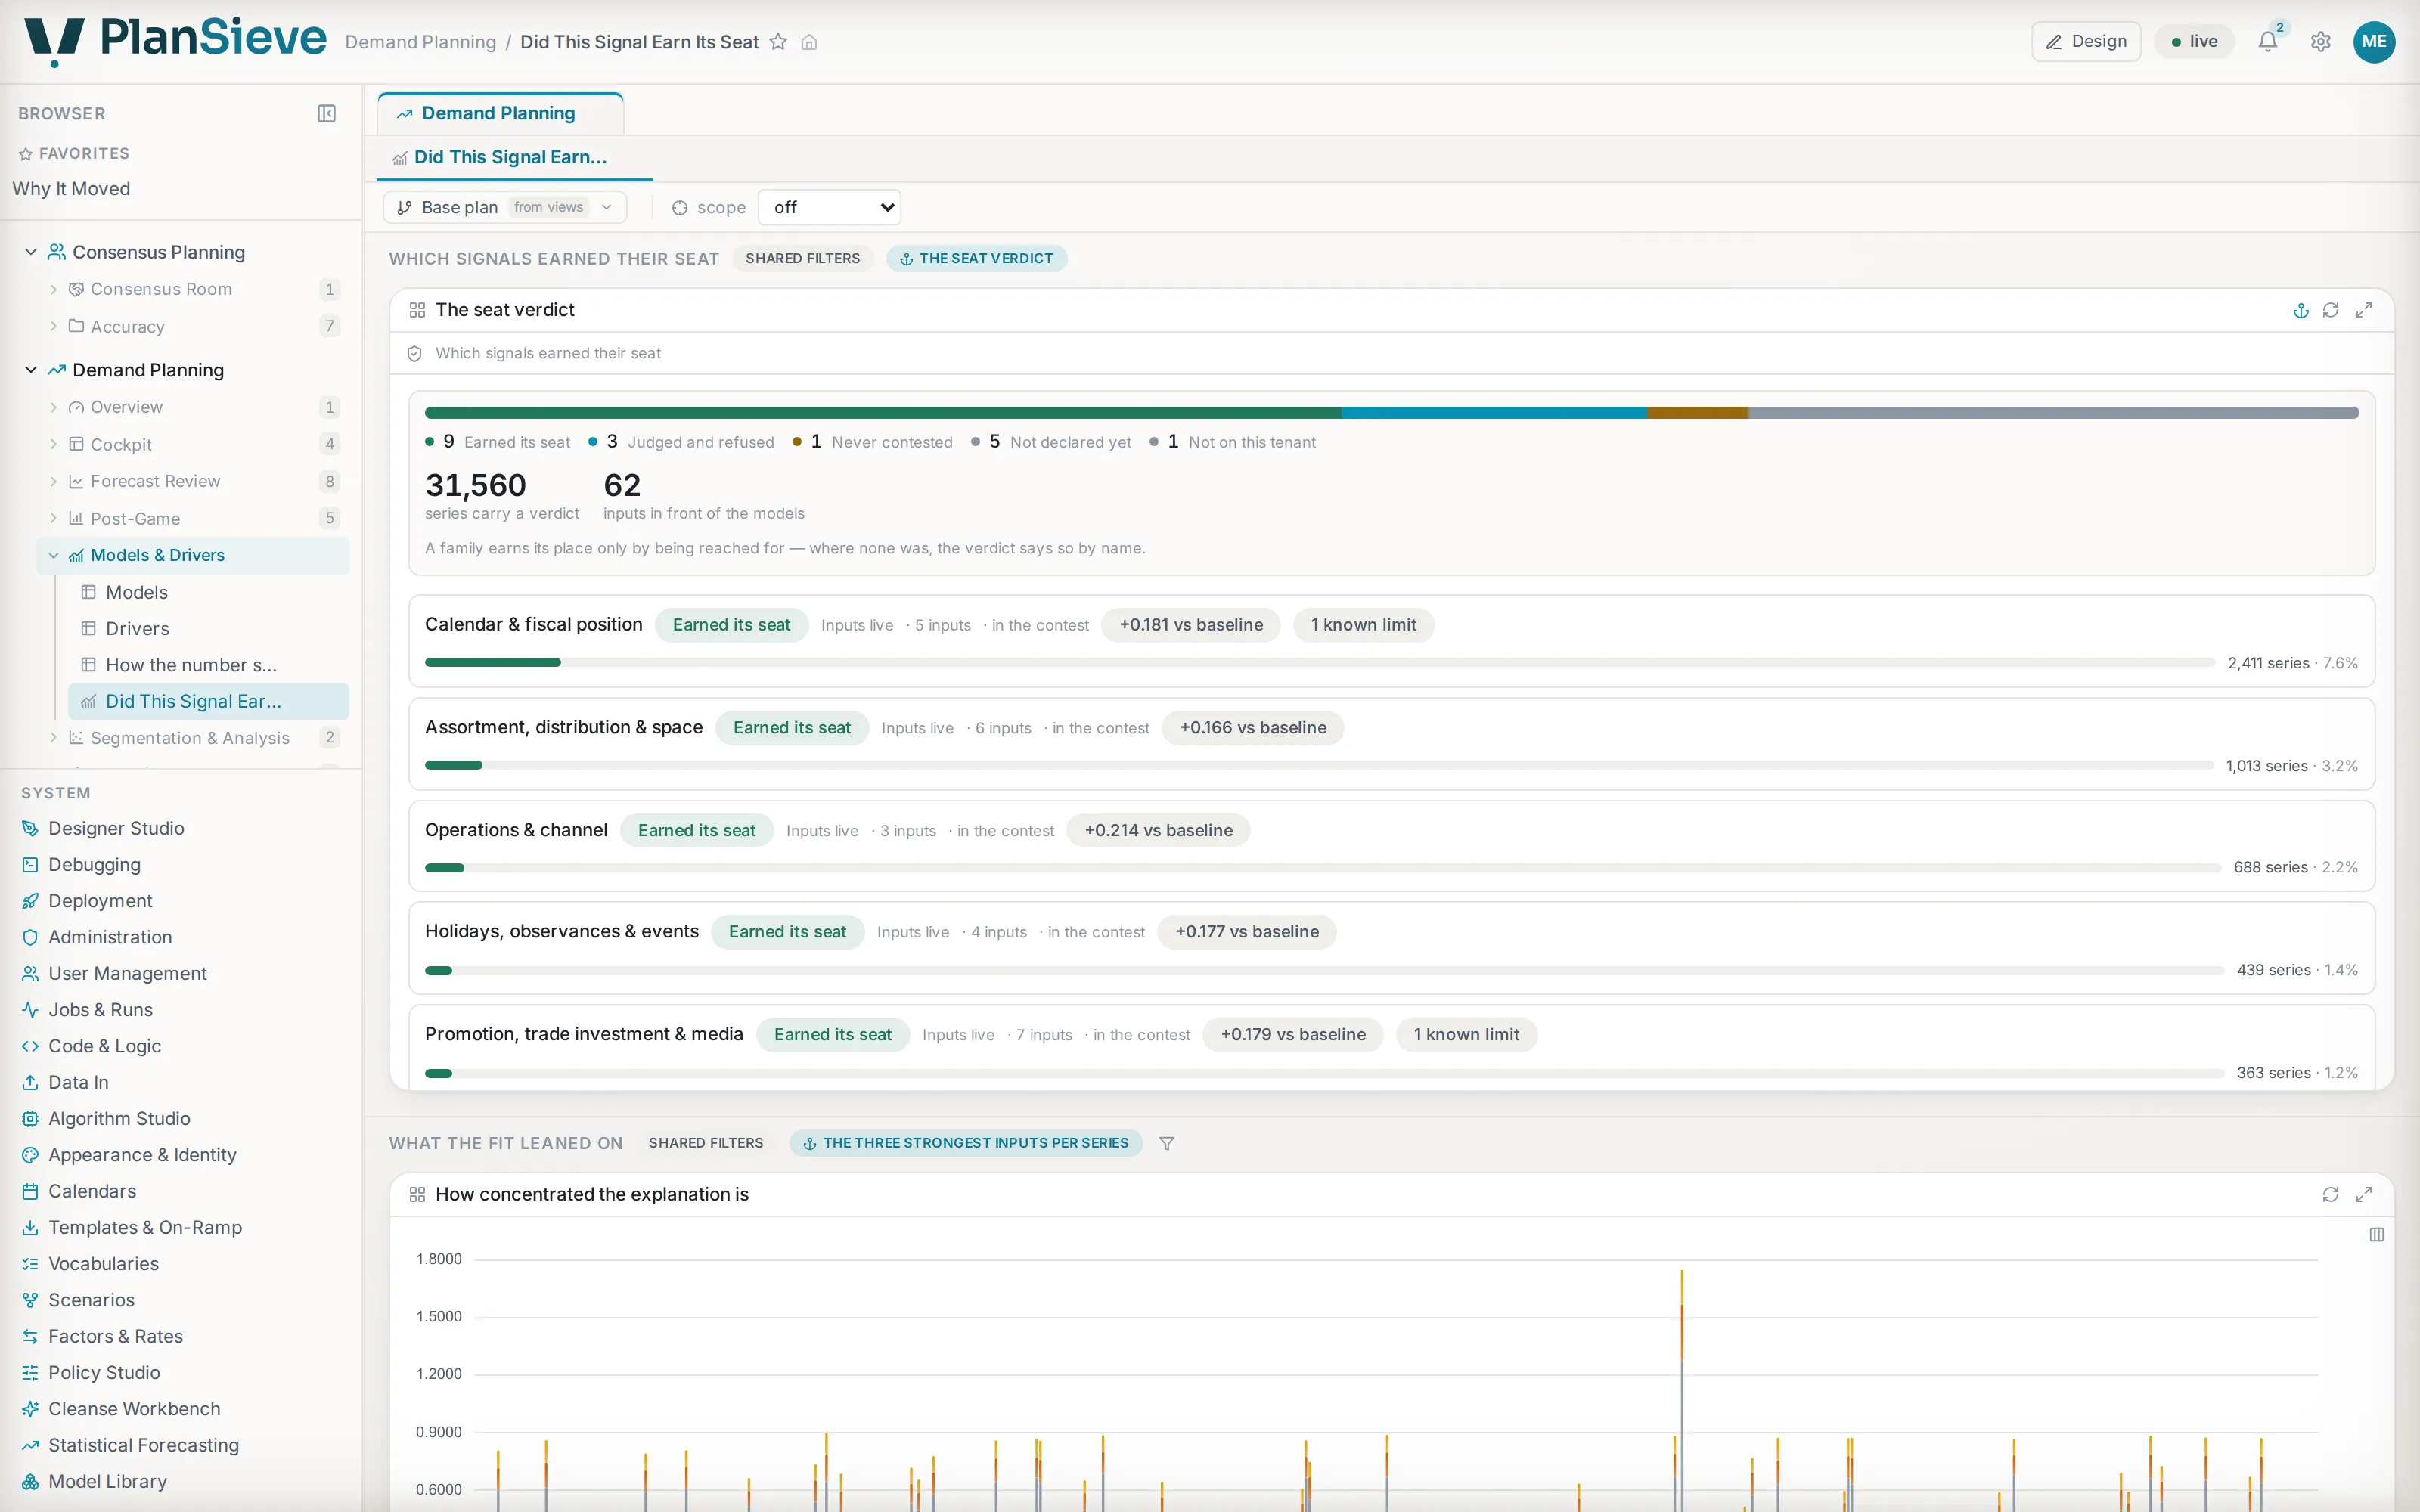
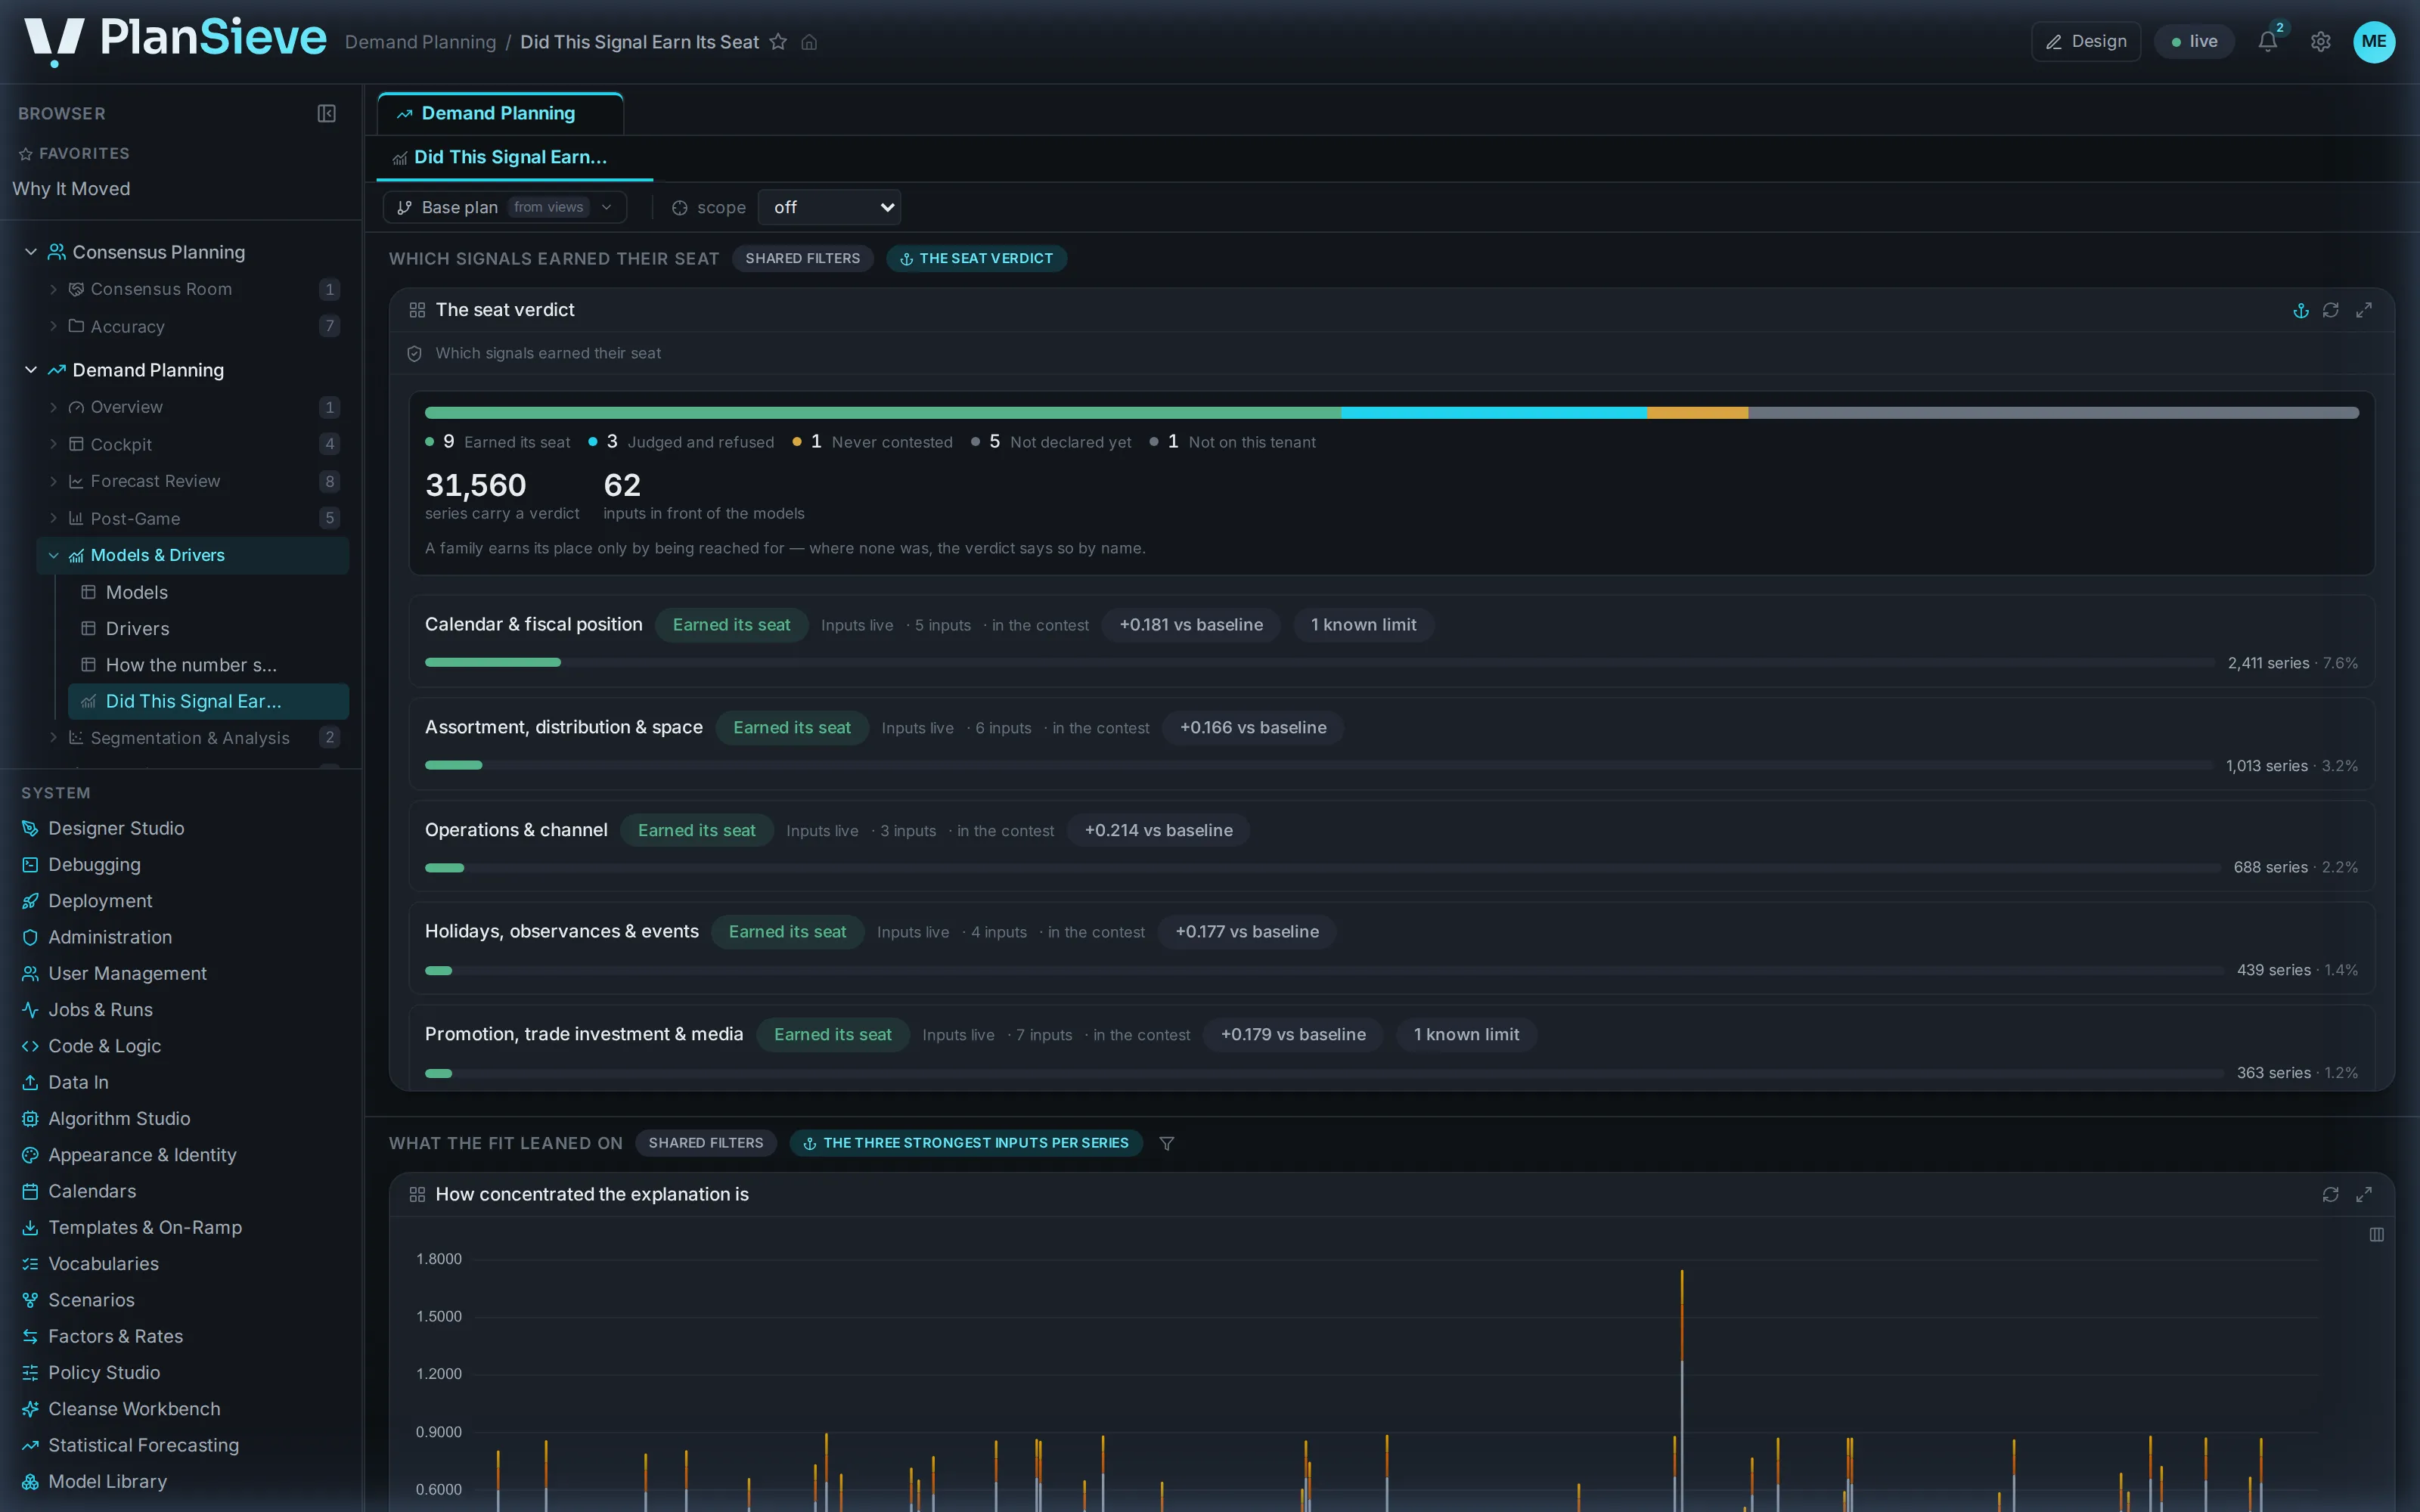
Every driver you switch on (weather, price, promotion, events) is backtested against the series it claims to explain. If it does not improve the forecast, it does not get a seat, and the page says so in plain words with the score beside it. Every driver family walks one ladder: declared, materialised, fed, judged, and the catalog never claims a driver works; the contest measures whether it earned its seat, per series.
A tool that only ever agrees with itself is not evidence. A refusal is.
0 of 2,310
series on which weather earned a seat: real weather, loaded through the connector plane and put in front of the models
paired champion score 0.5093 → 0.5104; a demo world whose demand was generated without weather: the platform measured it and said no
04 · The policy
Every setting is yours, at the level you pick.
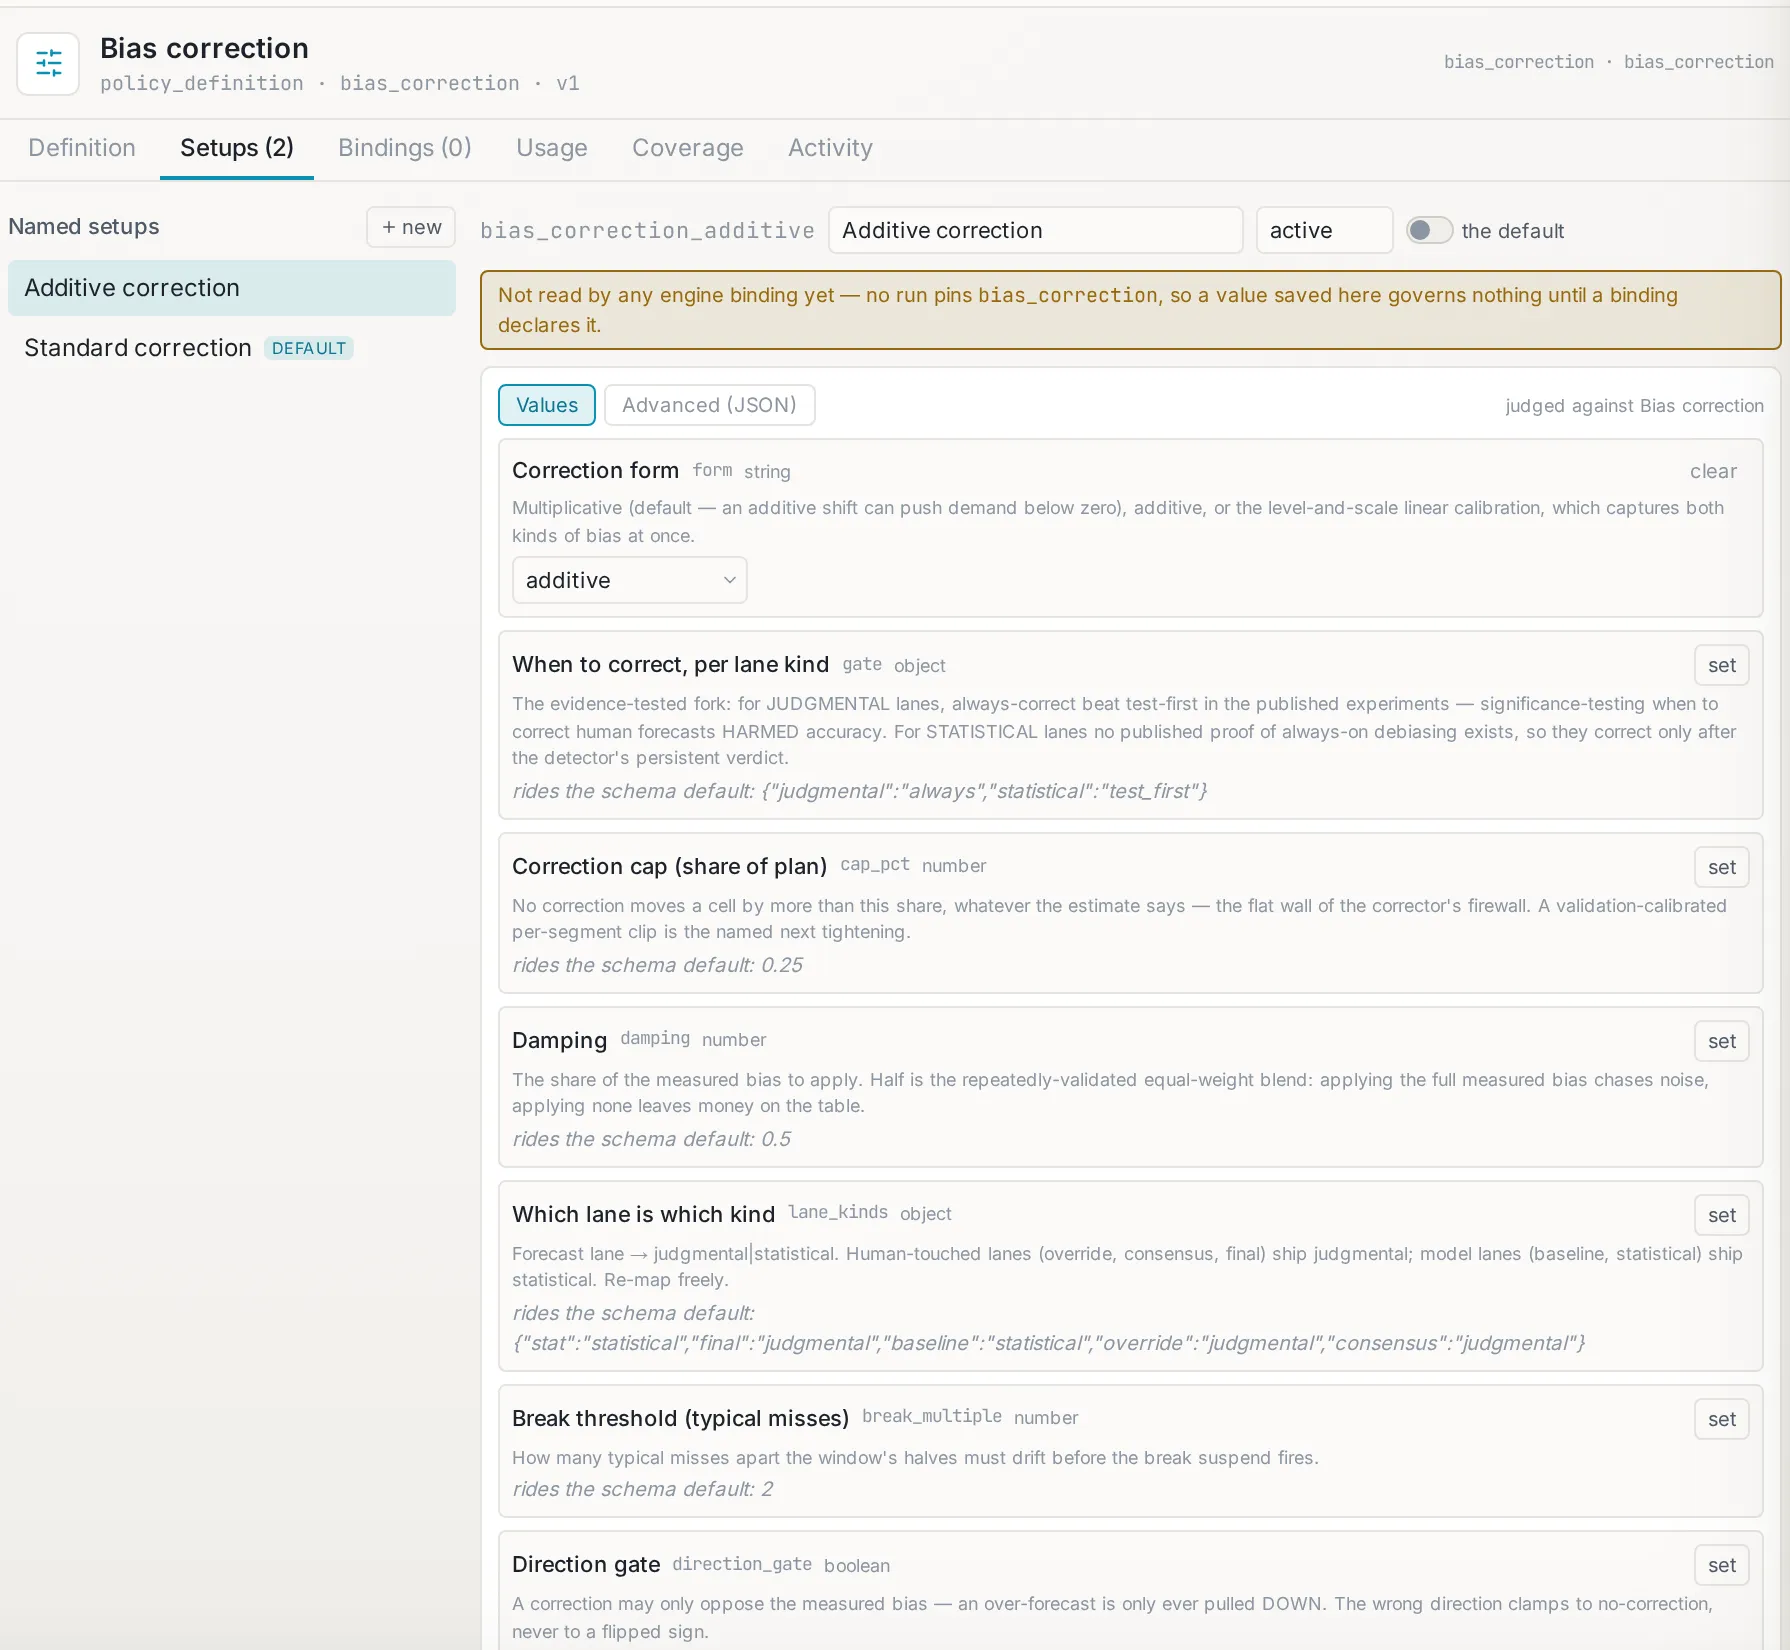
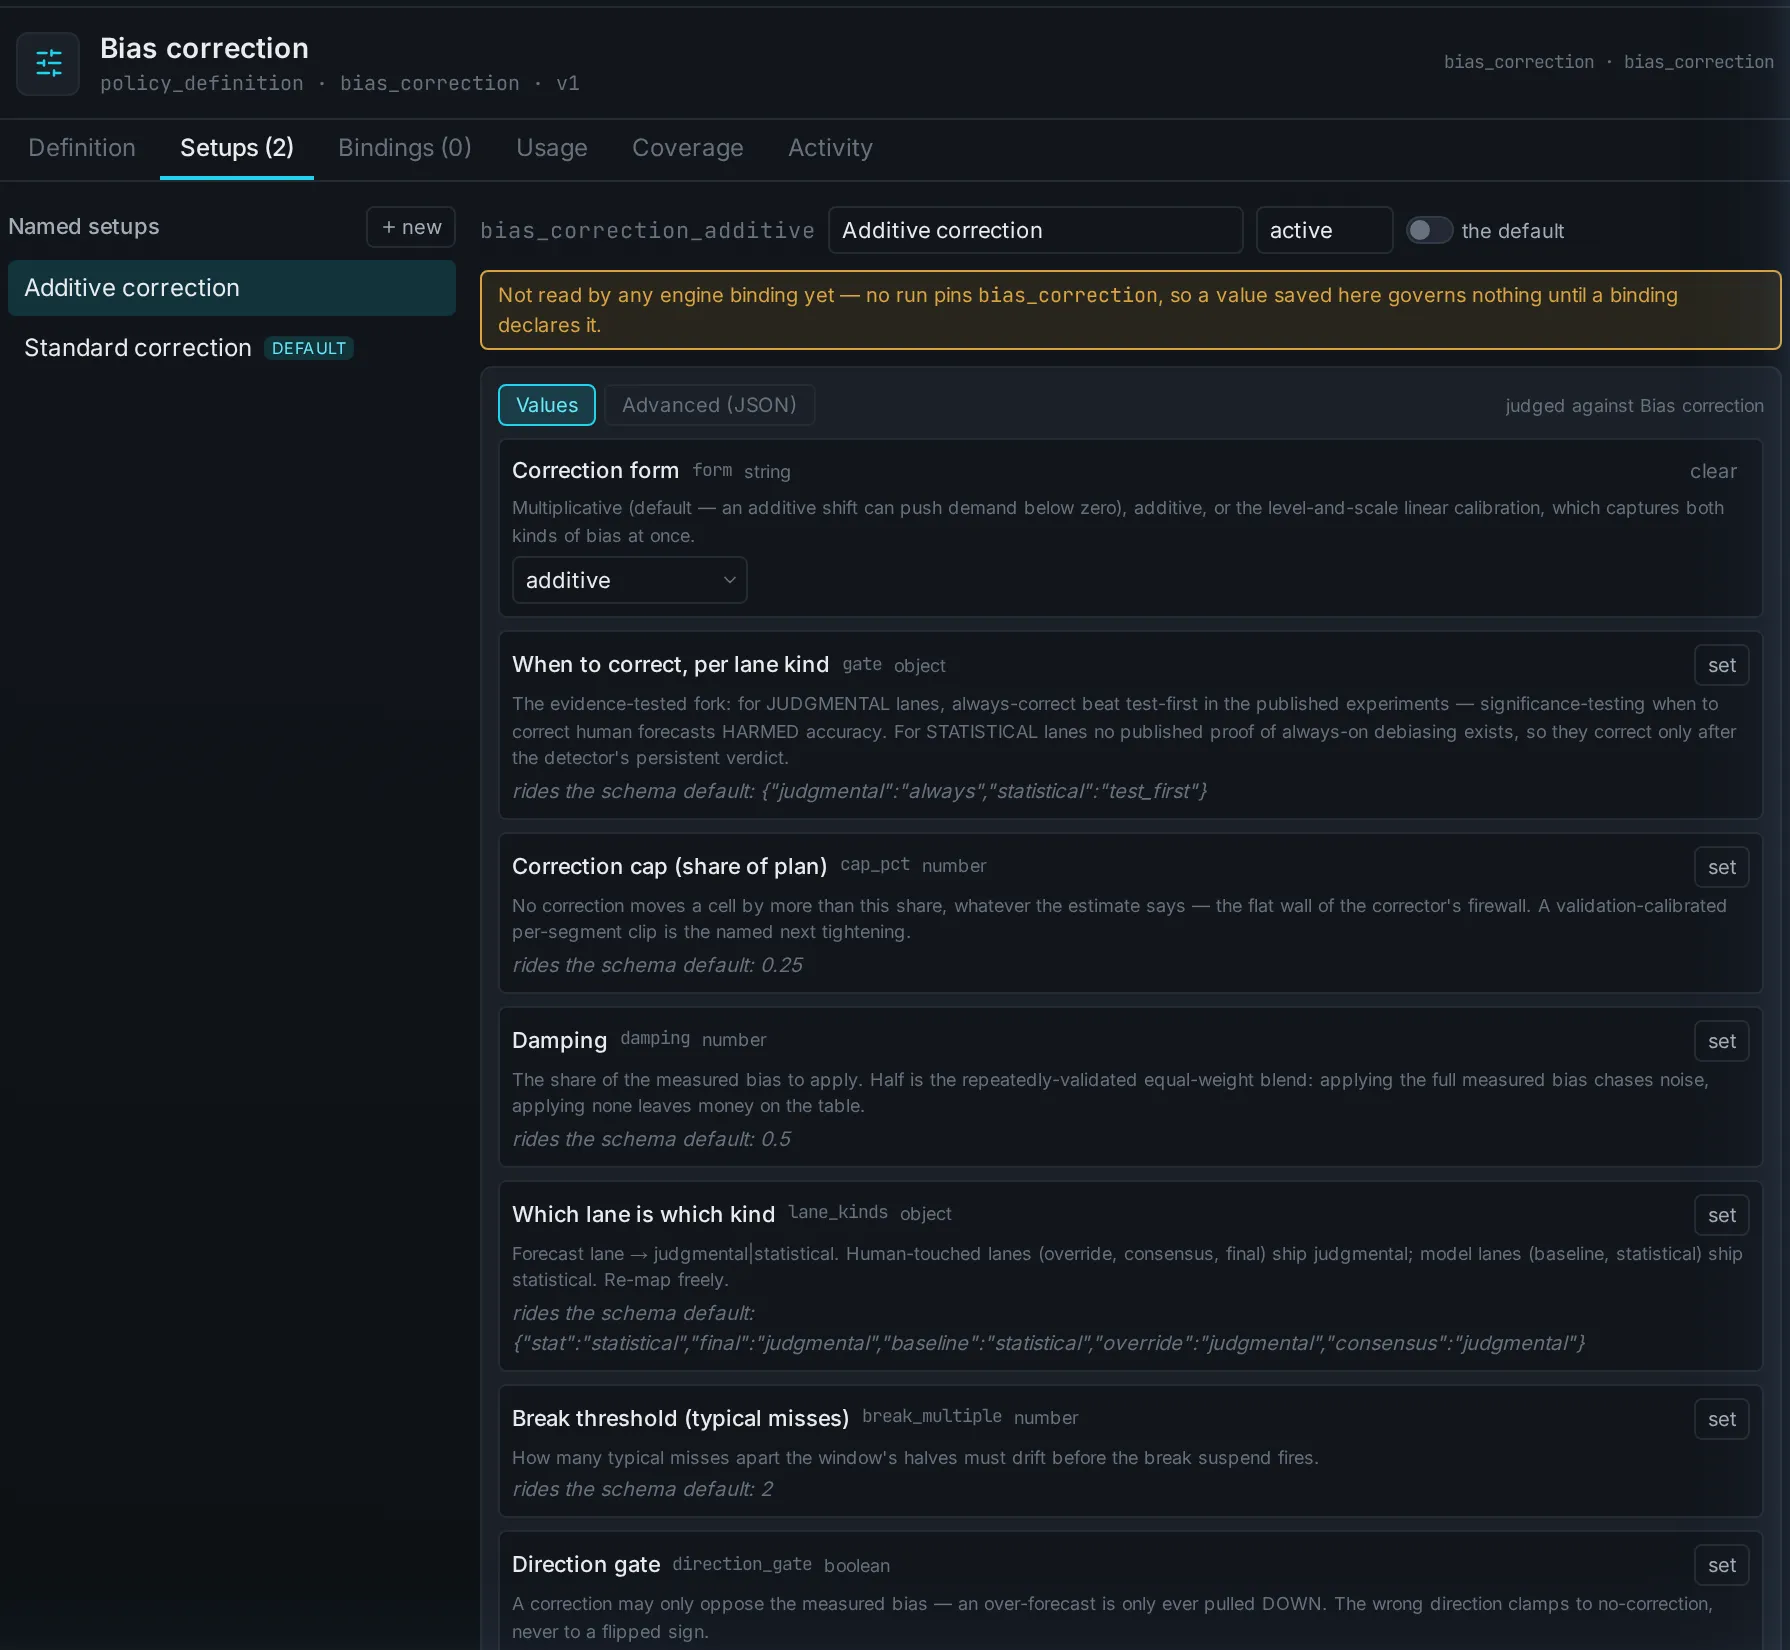
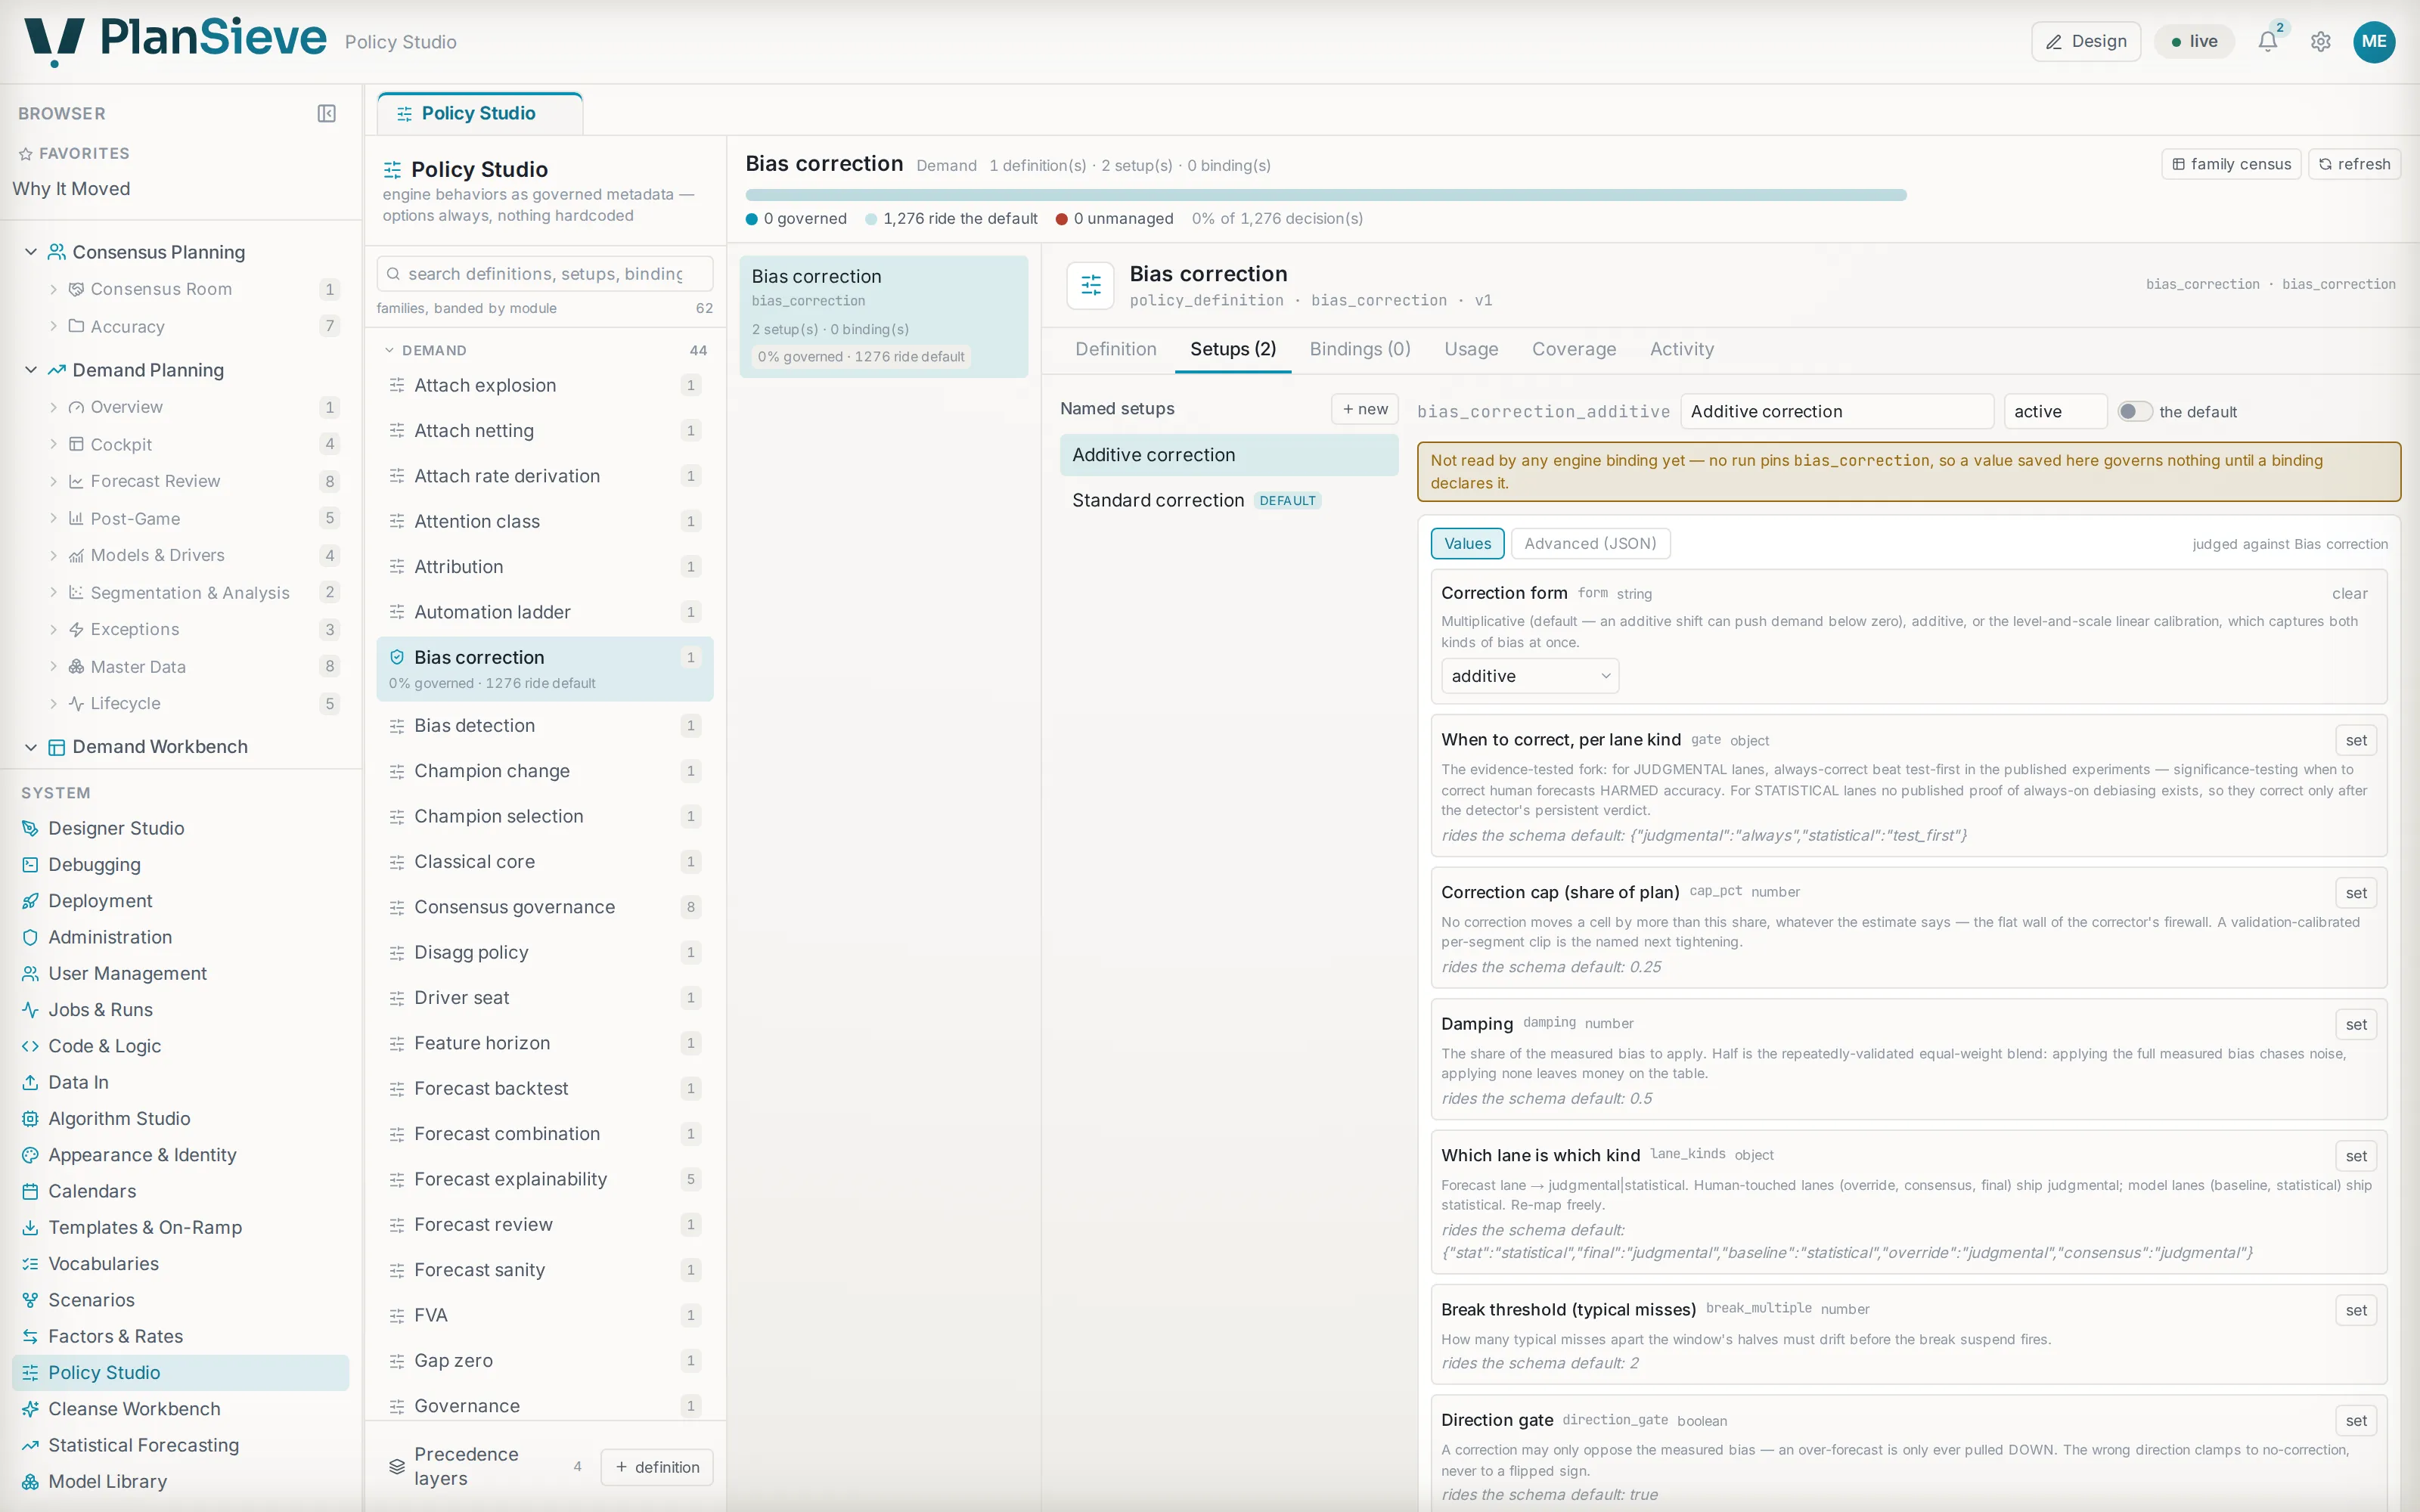
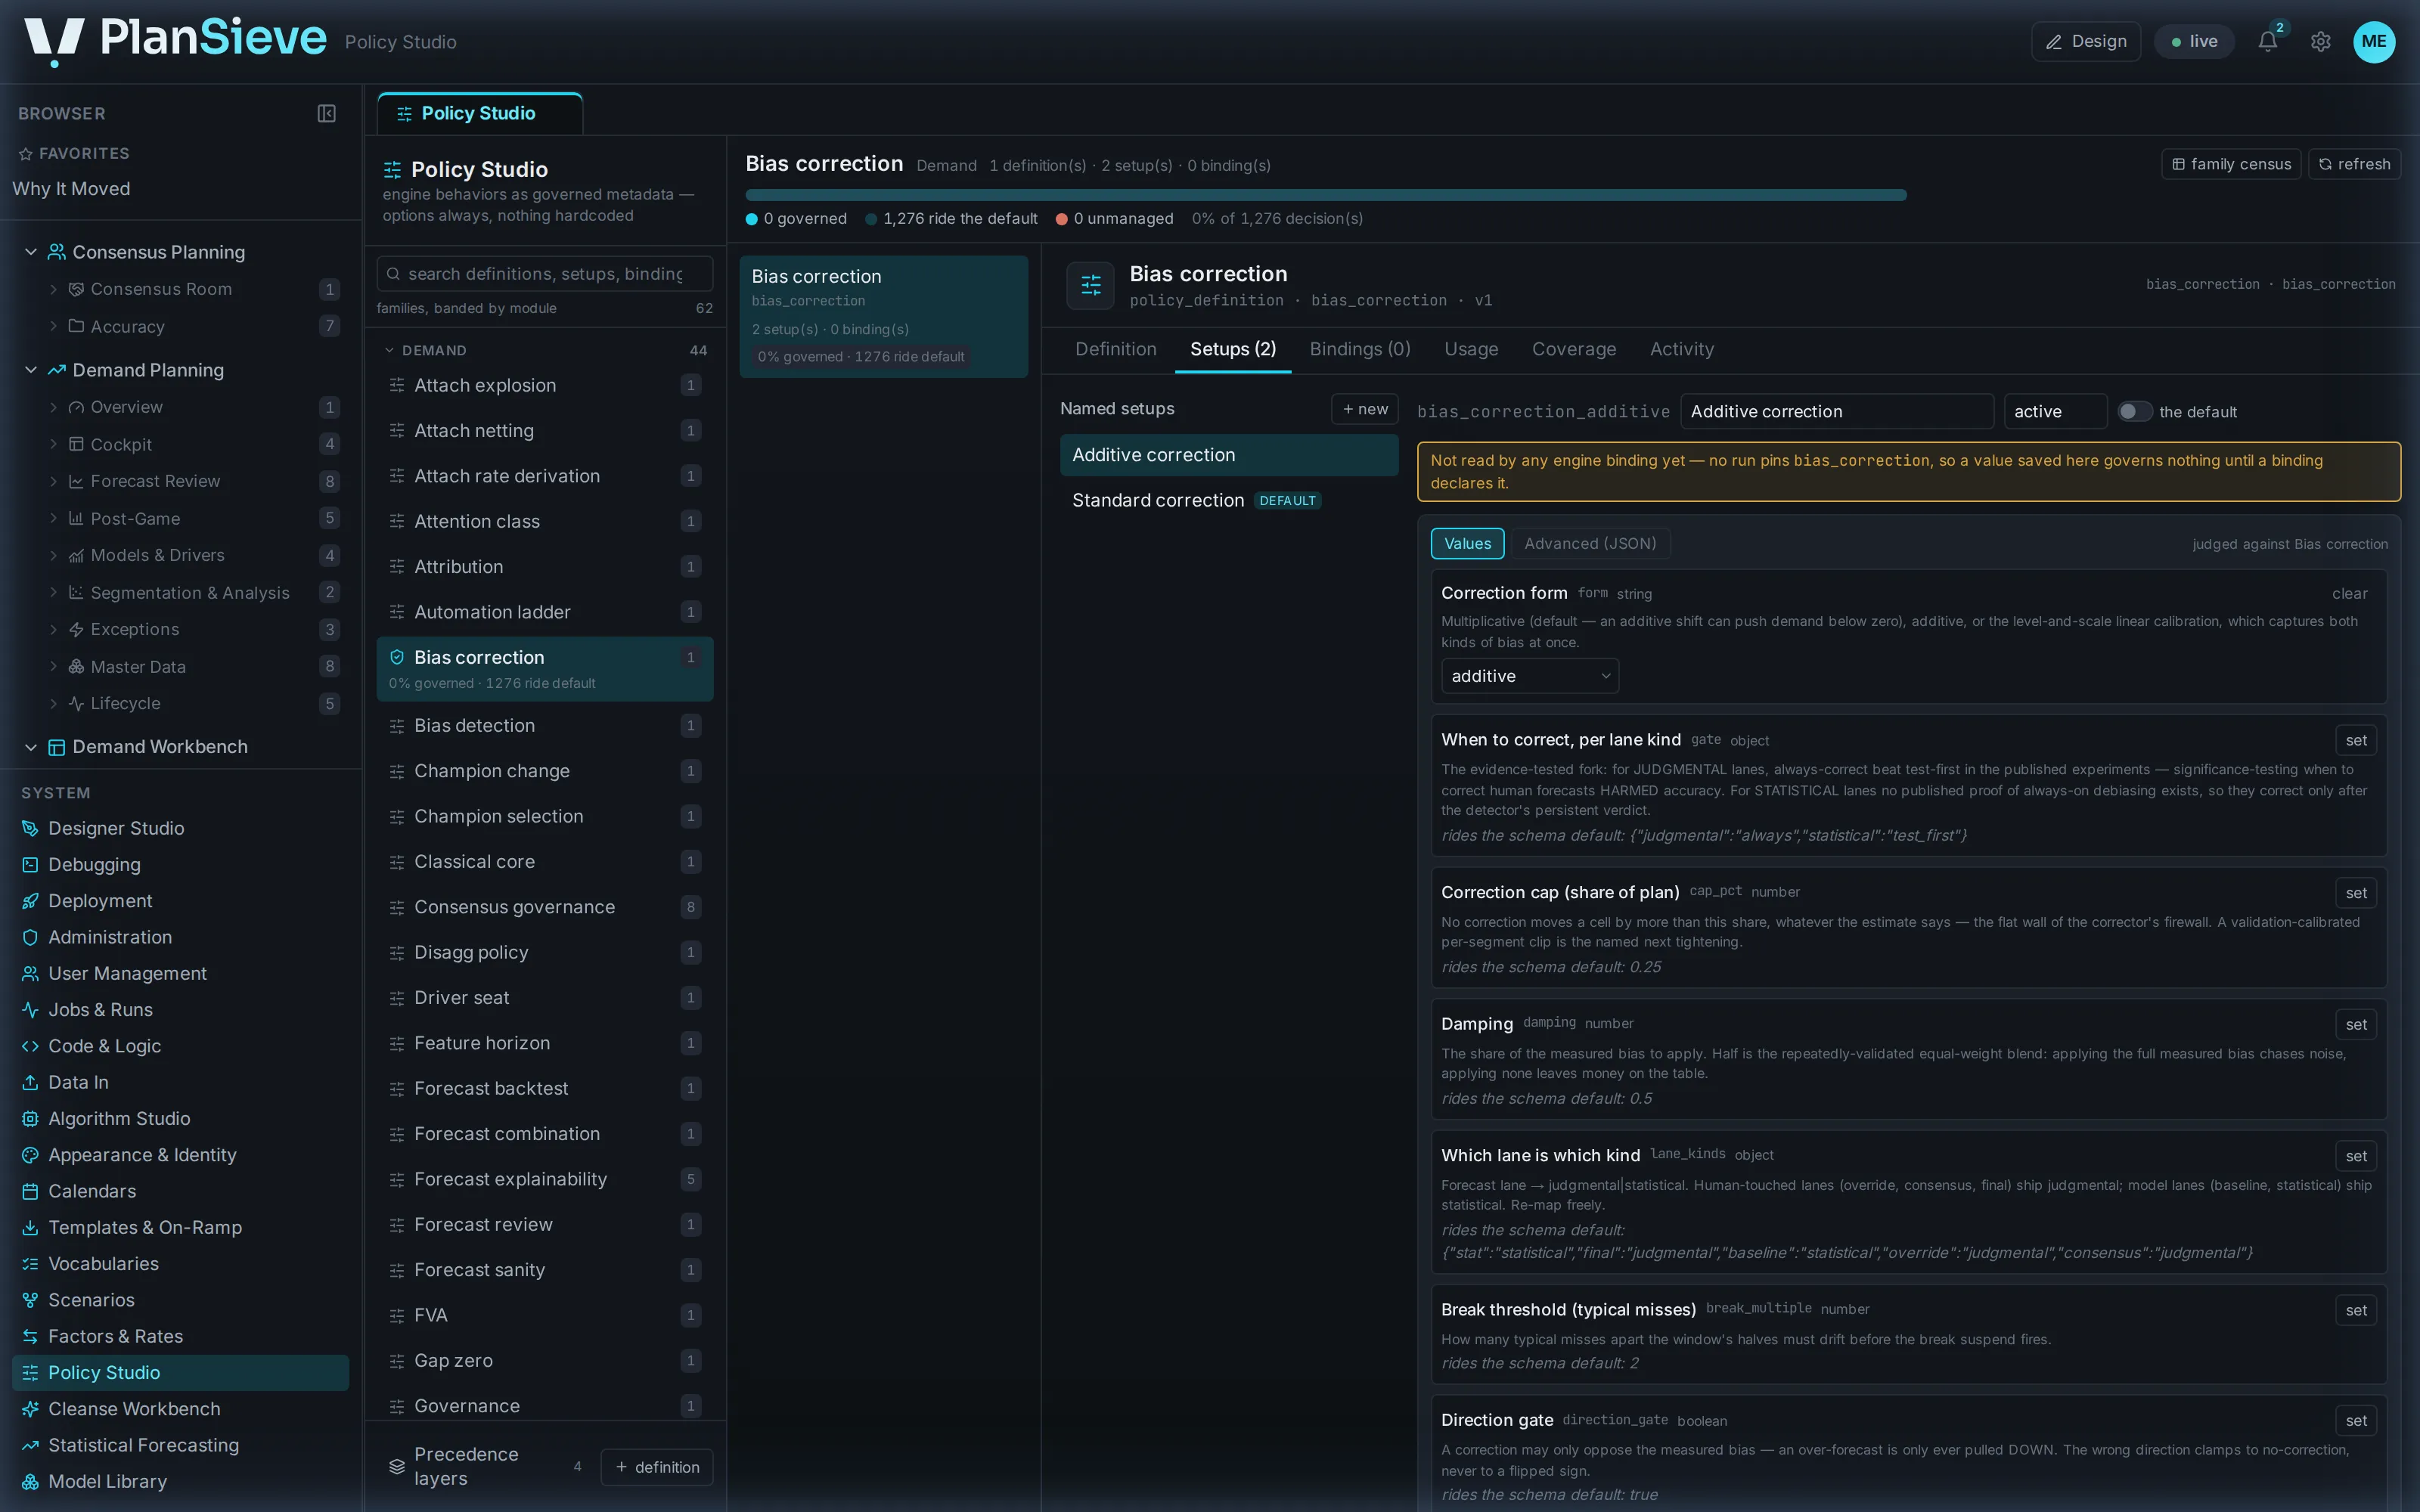
Cleansing, outlier treatment, stockout handling, launch curves, phase-out fences: each is a switch with a dial, pinned at a category, a region, a channel or a single item.
Set it once; everything underneath inherits it; one item can differ, on the record with a reason. The layers resolve in a fixed order: package default, tenant default, segment, series pin, and the page tells you which one a value is riding rather than hiding it.
In the module, the policies sit on a rail beside the plan. Each setting is a switch with the stages it runs at, a badge that says whether it was set here, inherited from above, or is a package default, an honest marker where no engine exists yet, and a line that says what a change here reaches. Then one verb,Apply at this level, with a dry-run preview of the scope, the overlaps and the reason the layer demands, before anything commits. Stop applying this here undoes it.
Turning a setting off doesn’t hide it. The engine measurably skips it.
14ms
the same lifecycle run with a setting off
169ms
with it on, off provably skips
single-node setup; measured in our lab, on our own test data
05 · The contest
A contest for every series, every cycle.
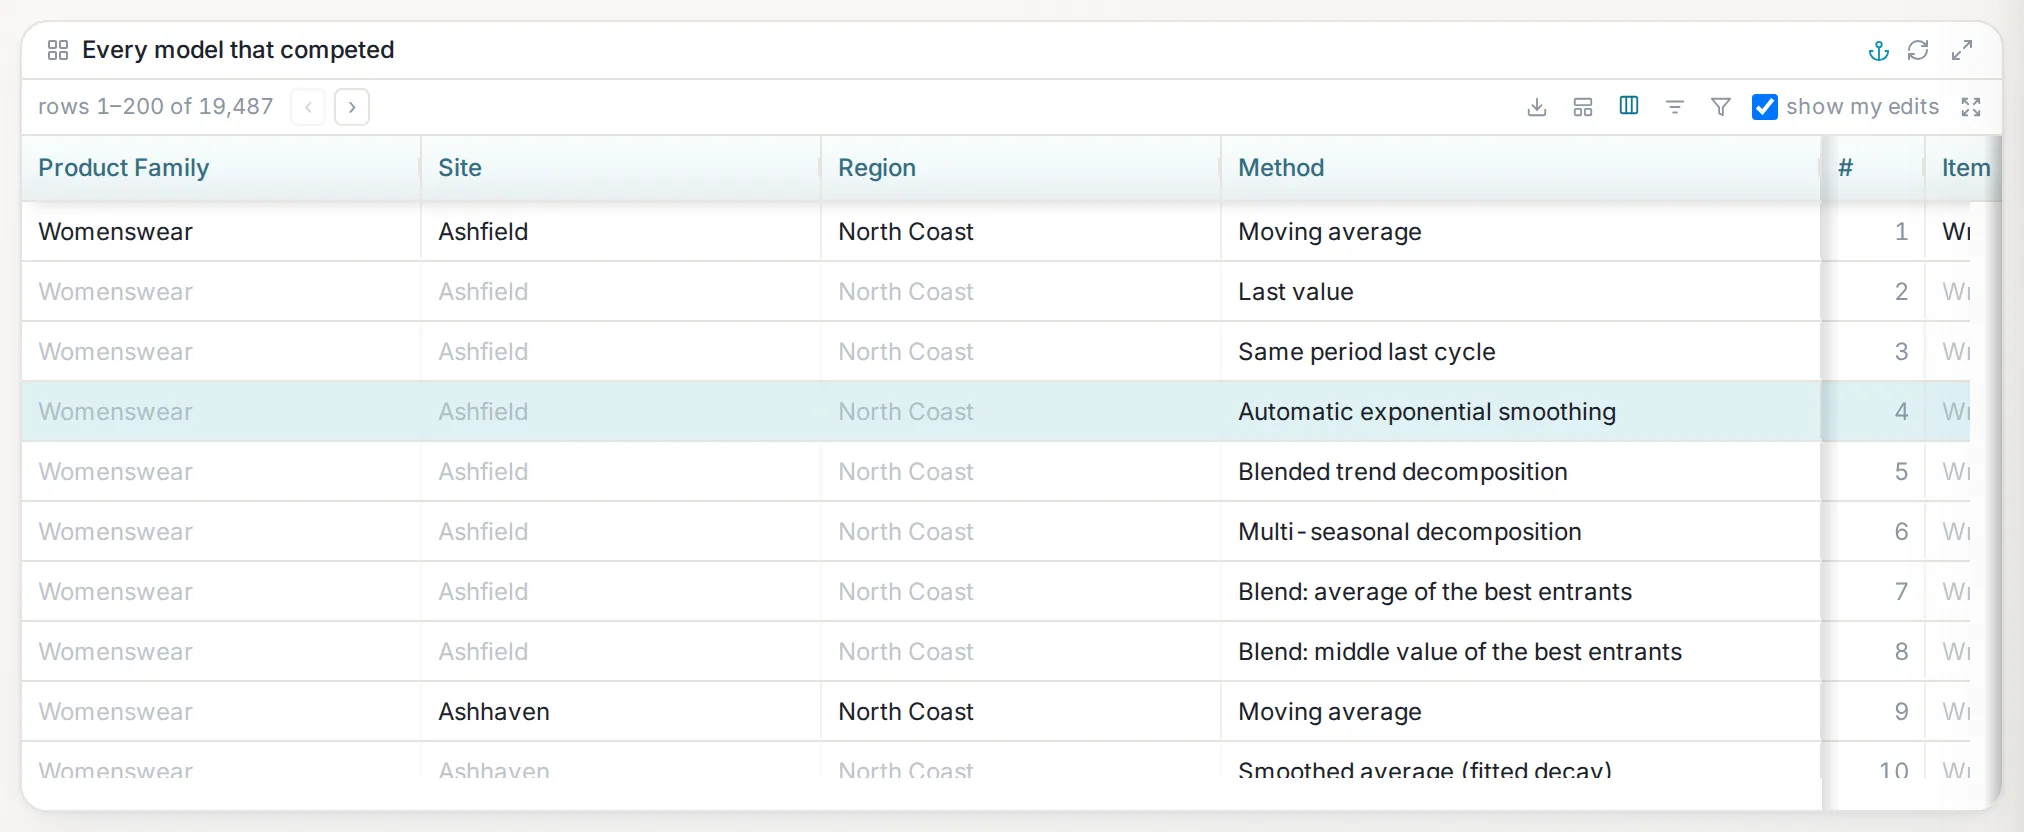
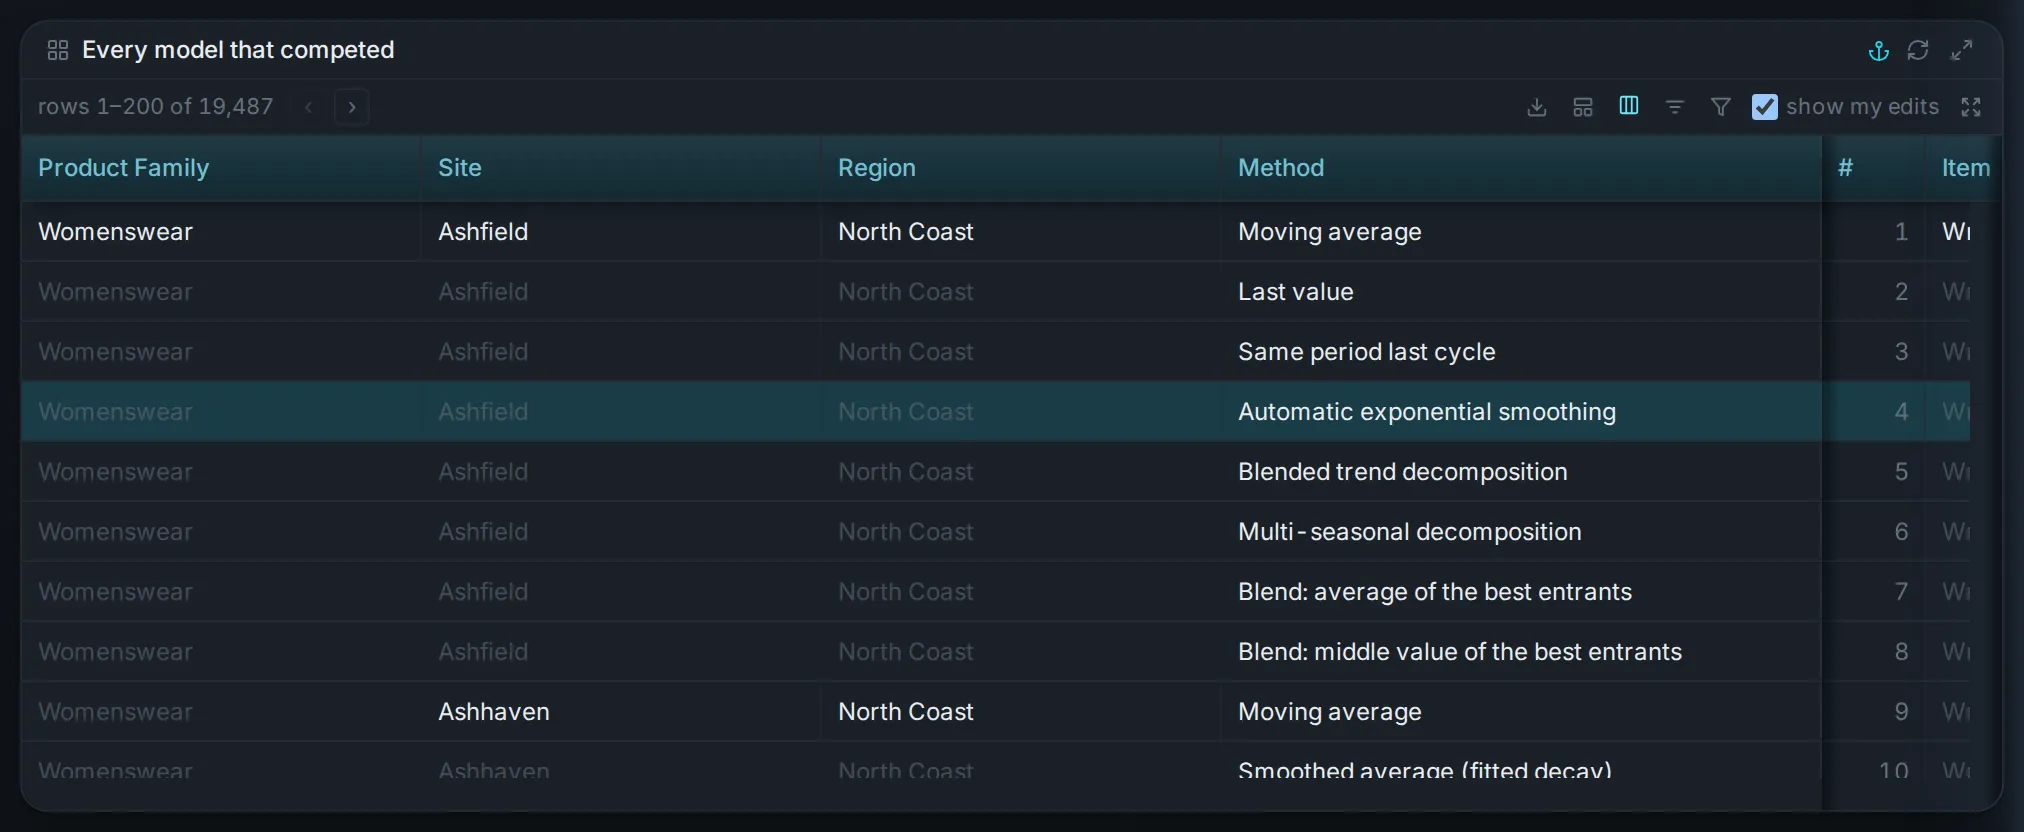
Simple methods, classical statistics, intermittent-demand methods and machine learning all compete on each series’ own history, scored on the same accuracy definition used everywhere else in the product.
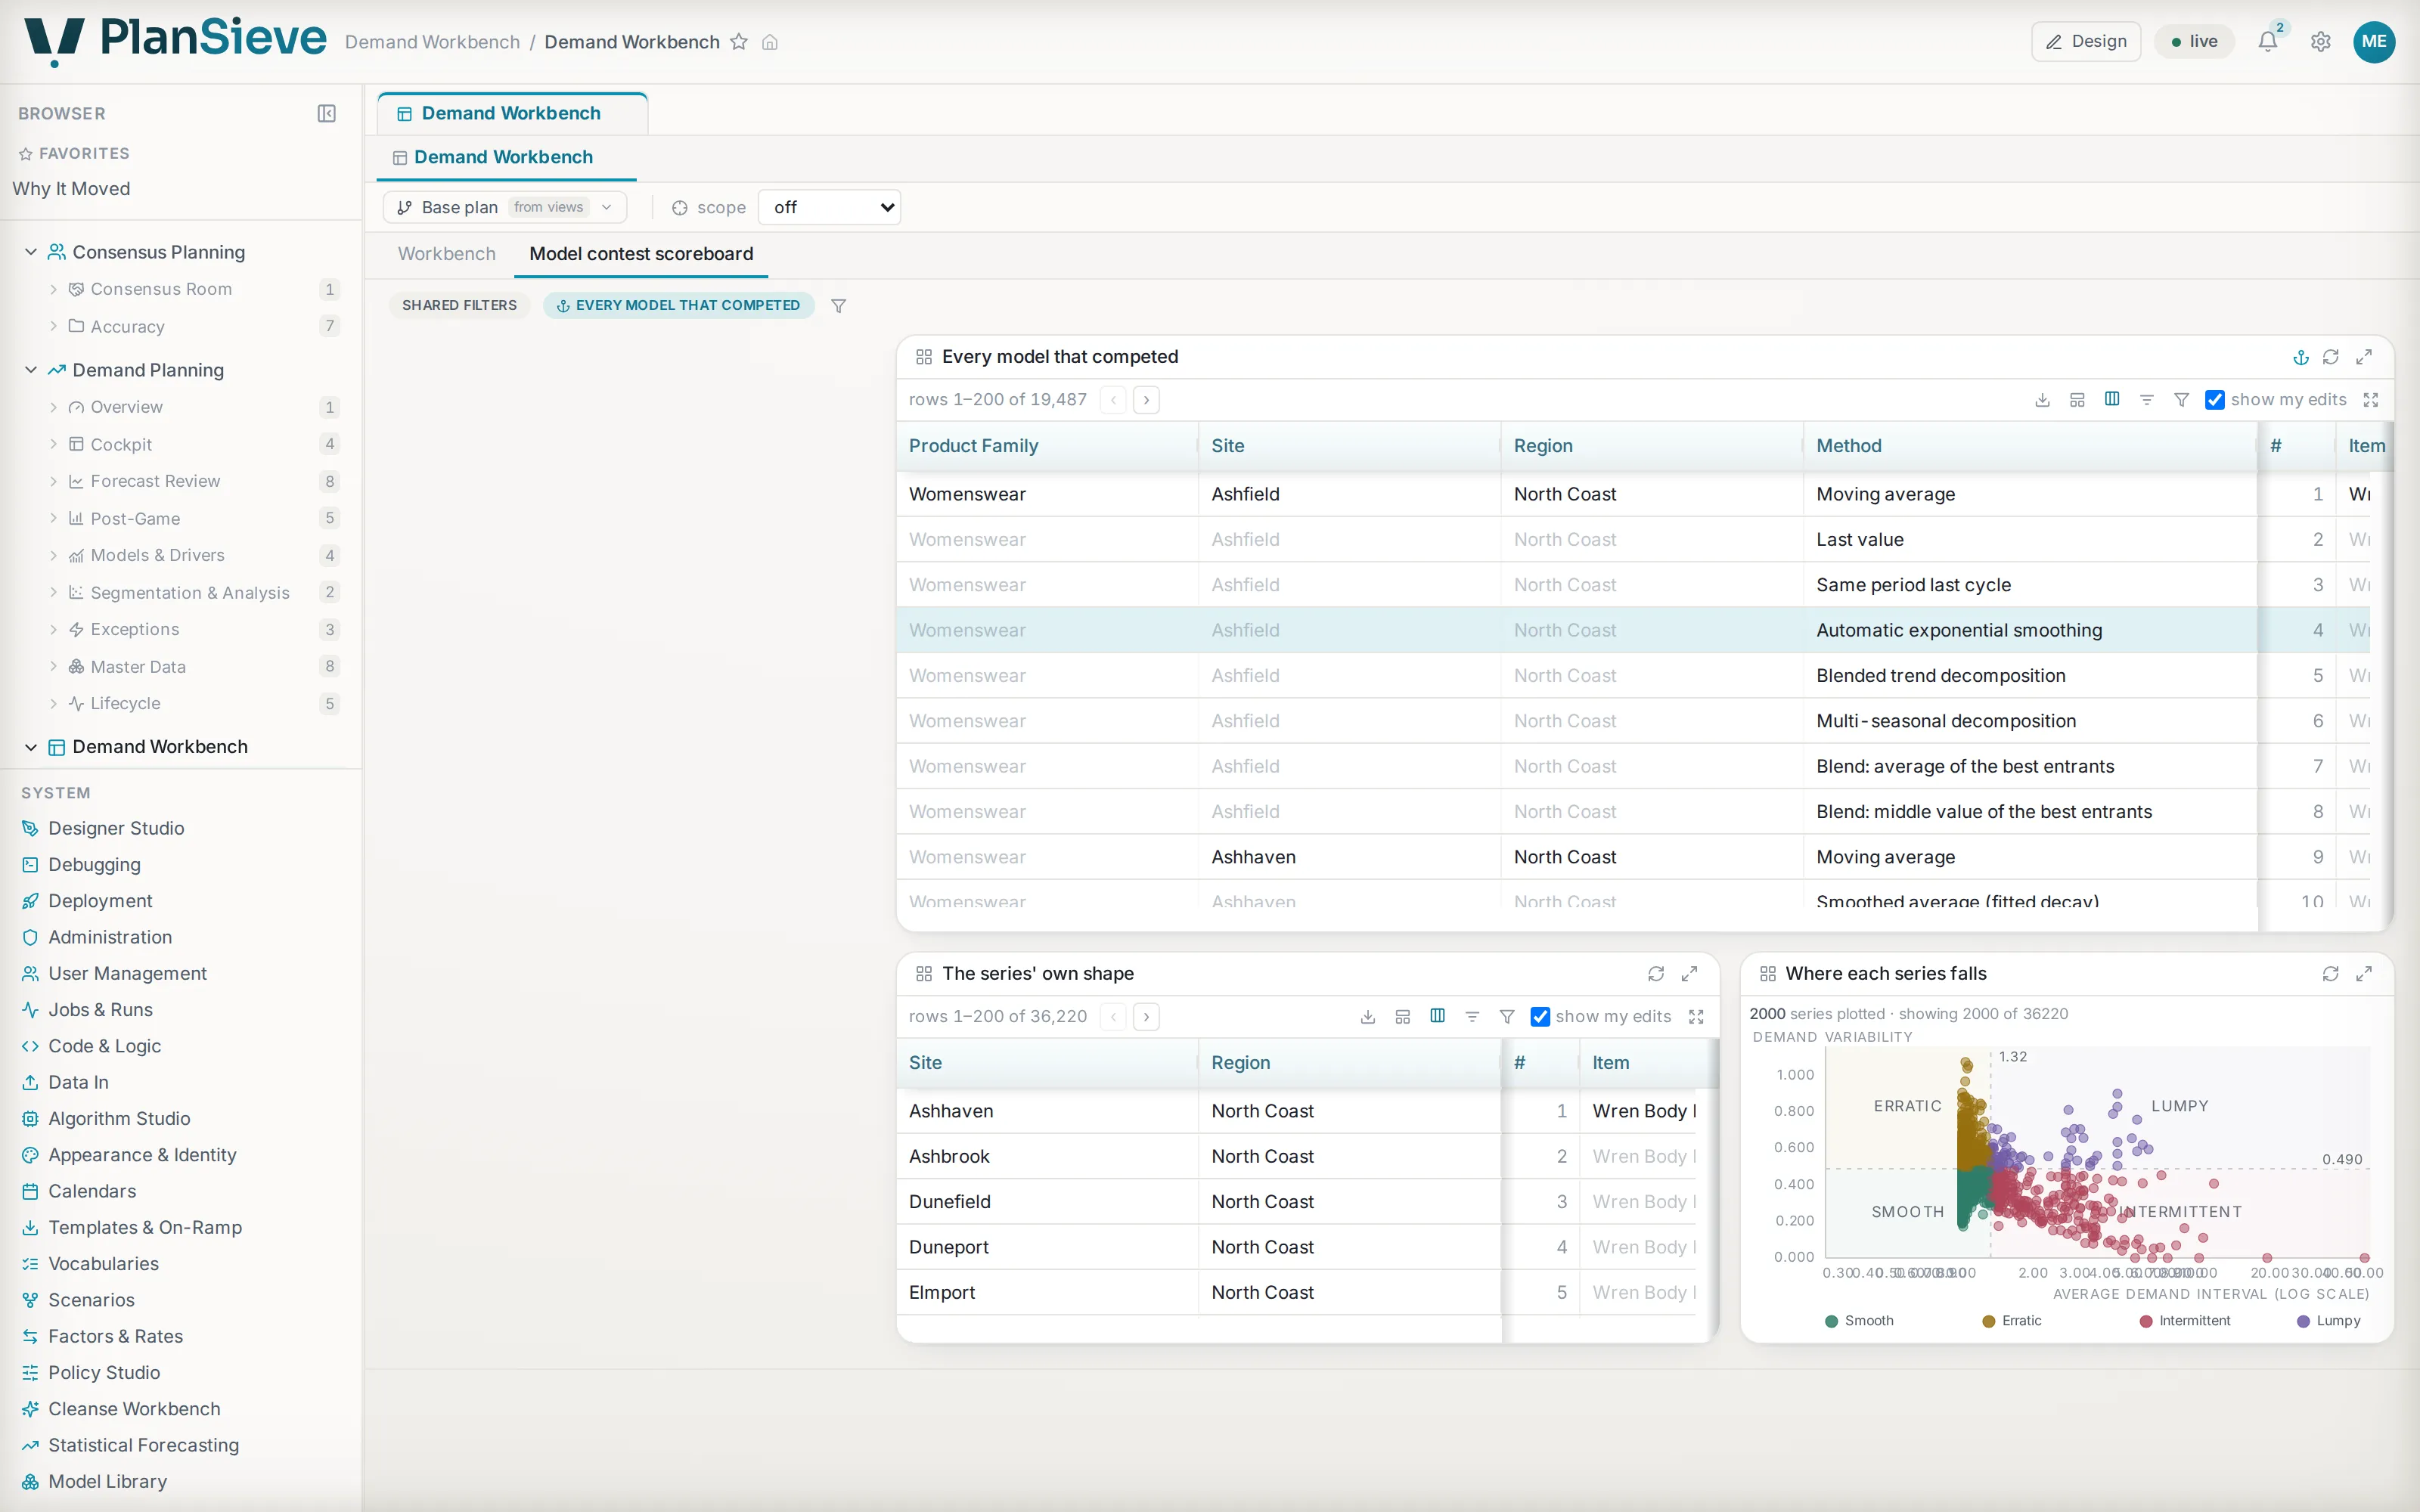
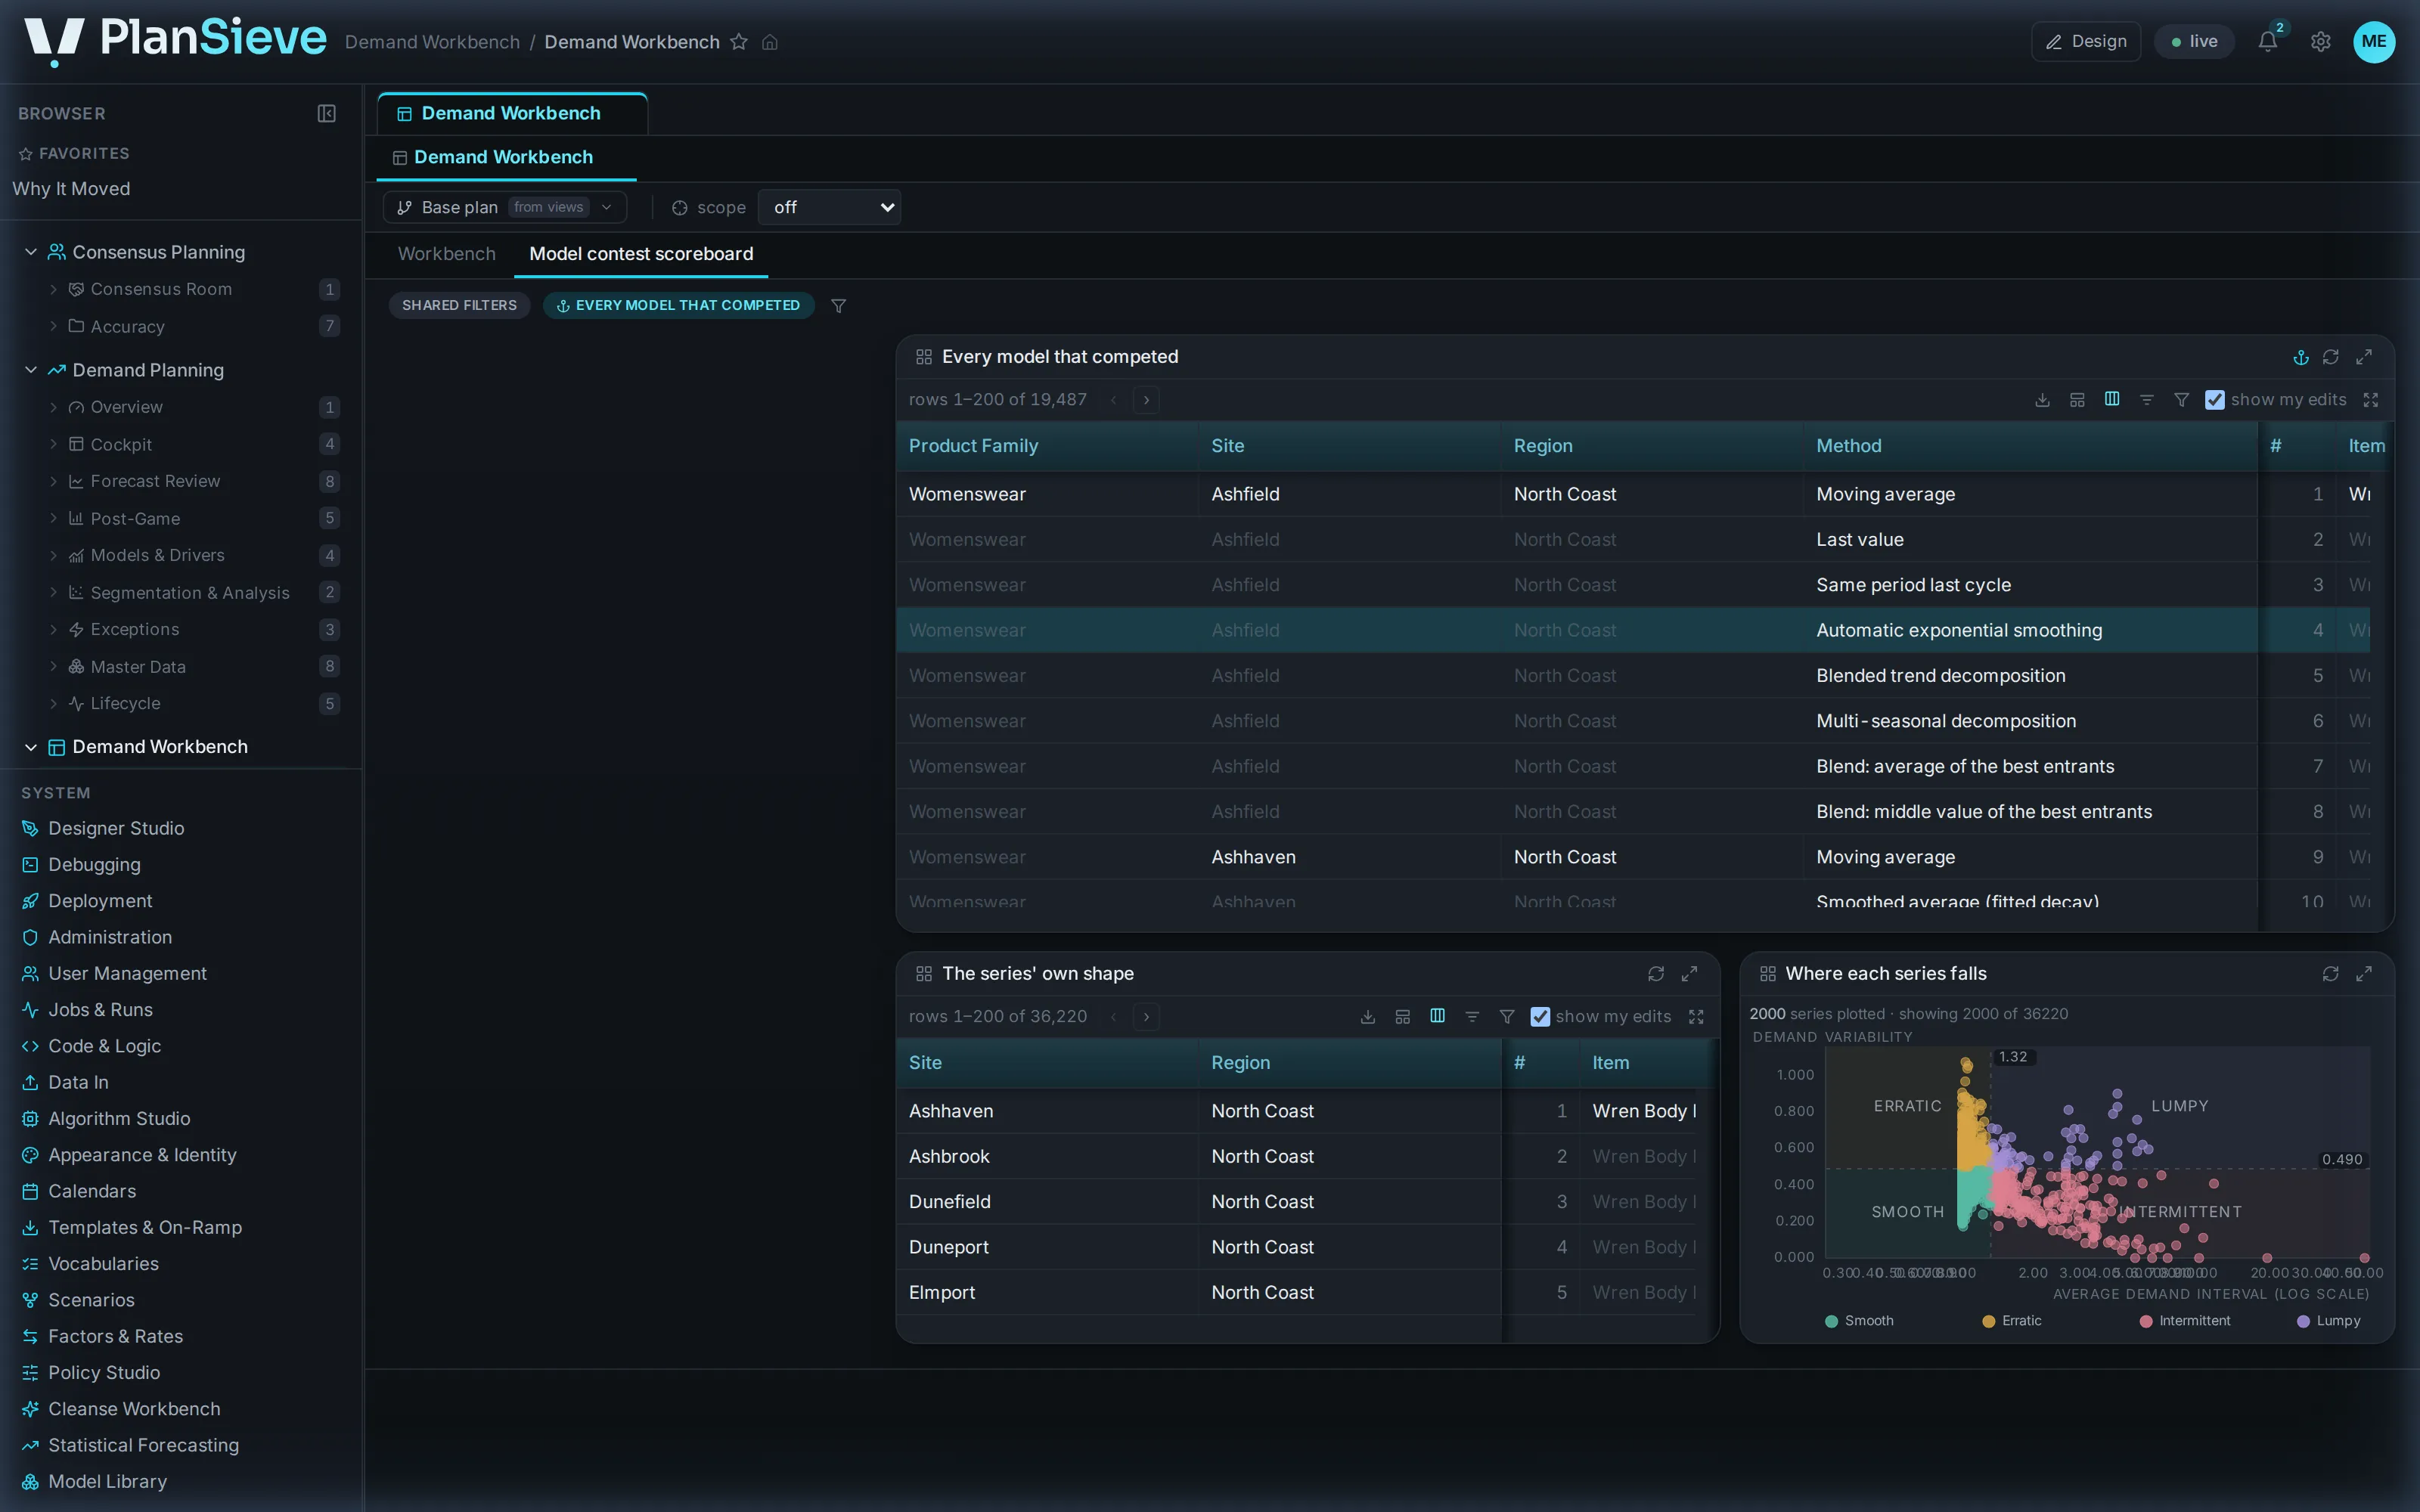
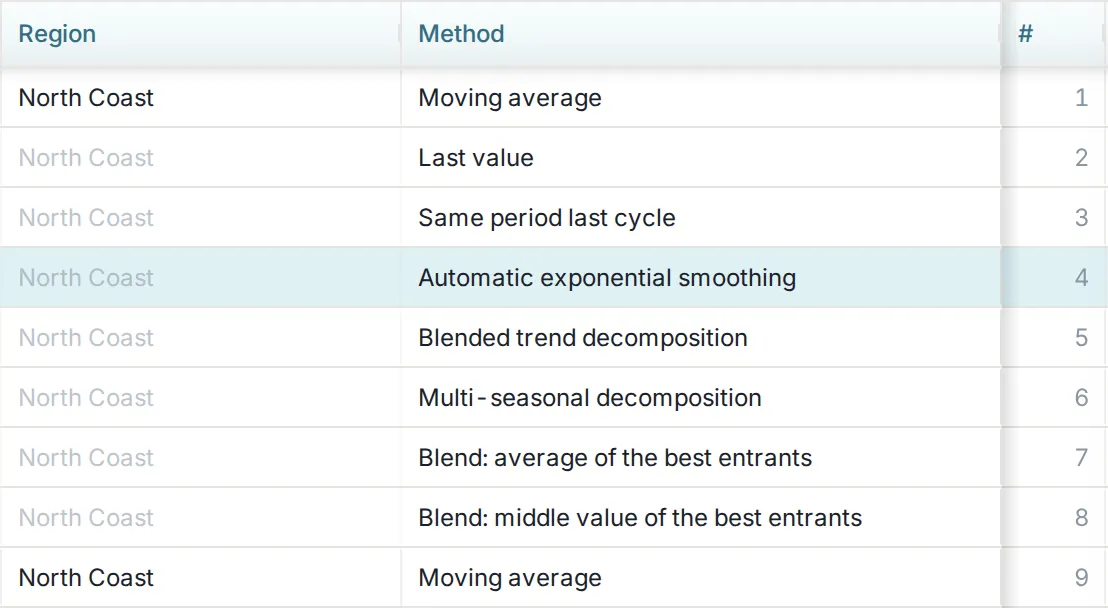
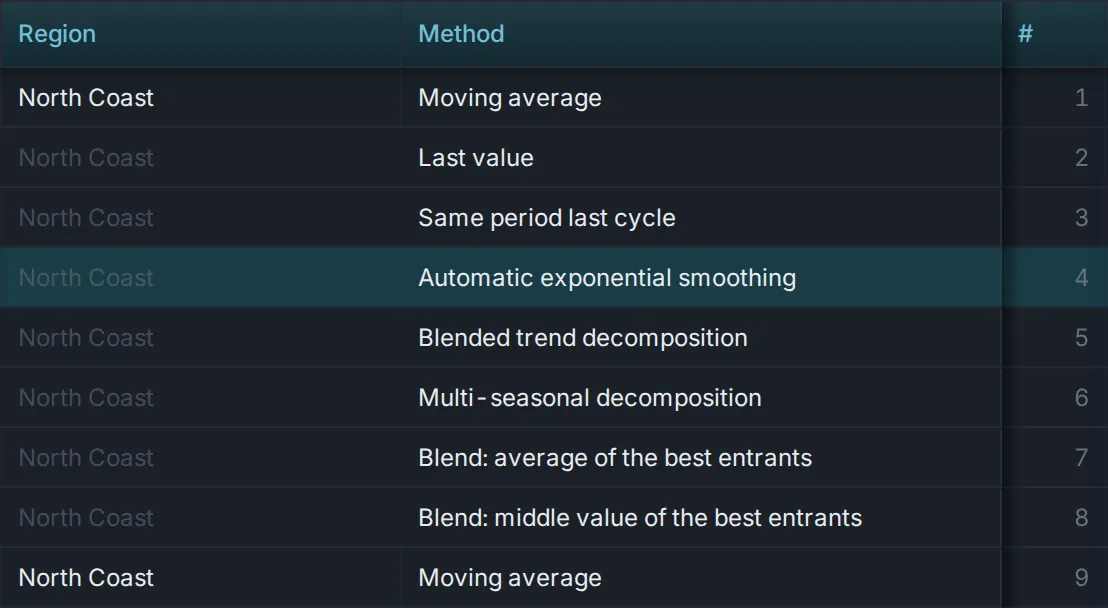
The winner is named on the grid, the scoreboard shows every challenger and the margin, and the ranges (P10 / P50 / P90) come from the model that won, not from a rule of thumb applied afterwards. The scoreboard is ordinary, filterable data: error, bias, rank, holdout, folds, margin, the champion flag and the reason, with the demand pattern’s statistics beside each candidate.
Rerun the contest for a selection from the rail, or pin a model for a series with a governed reason. The override is data too, and the next cycle reads it.
36,220
series classified in one full-portfolio contest, run as a governed job
108.9min
to judge 31,151 series and publish 800k forecast cells , 1,090 skipped honestly, 0 refused
a demo tenant; the run’s accuracy figure is not a claim
After the day
It will tell you when it was wrong. It will tell you when you were.
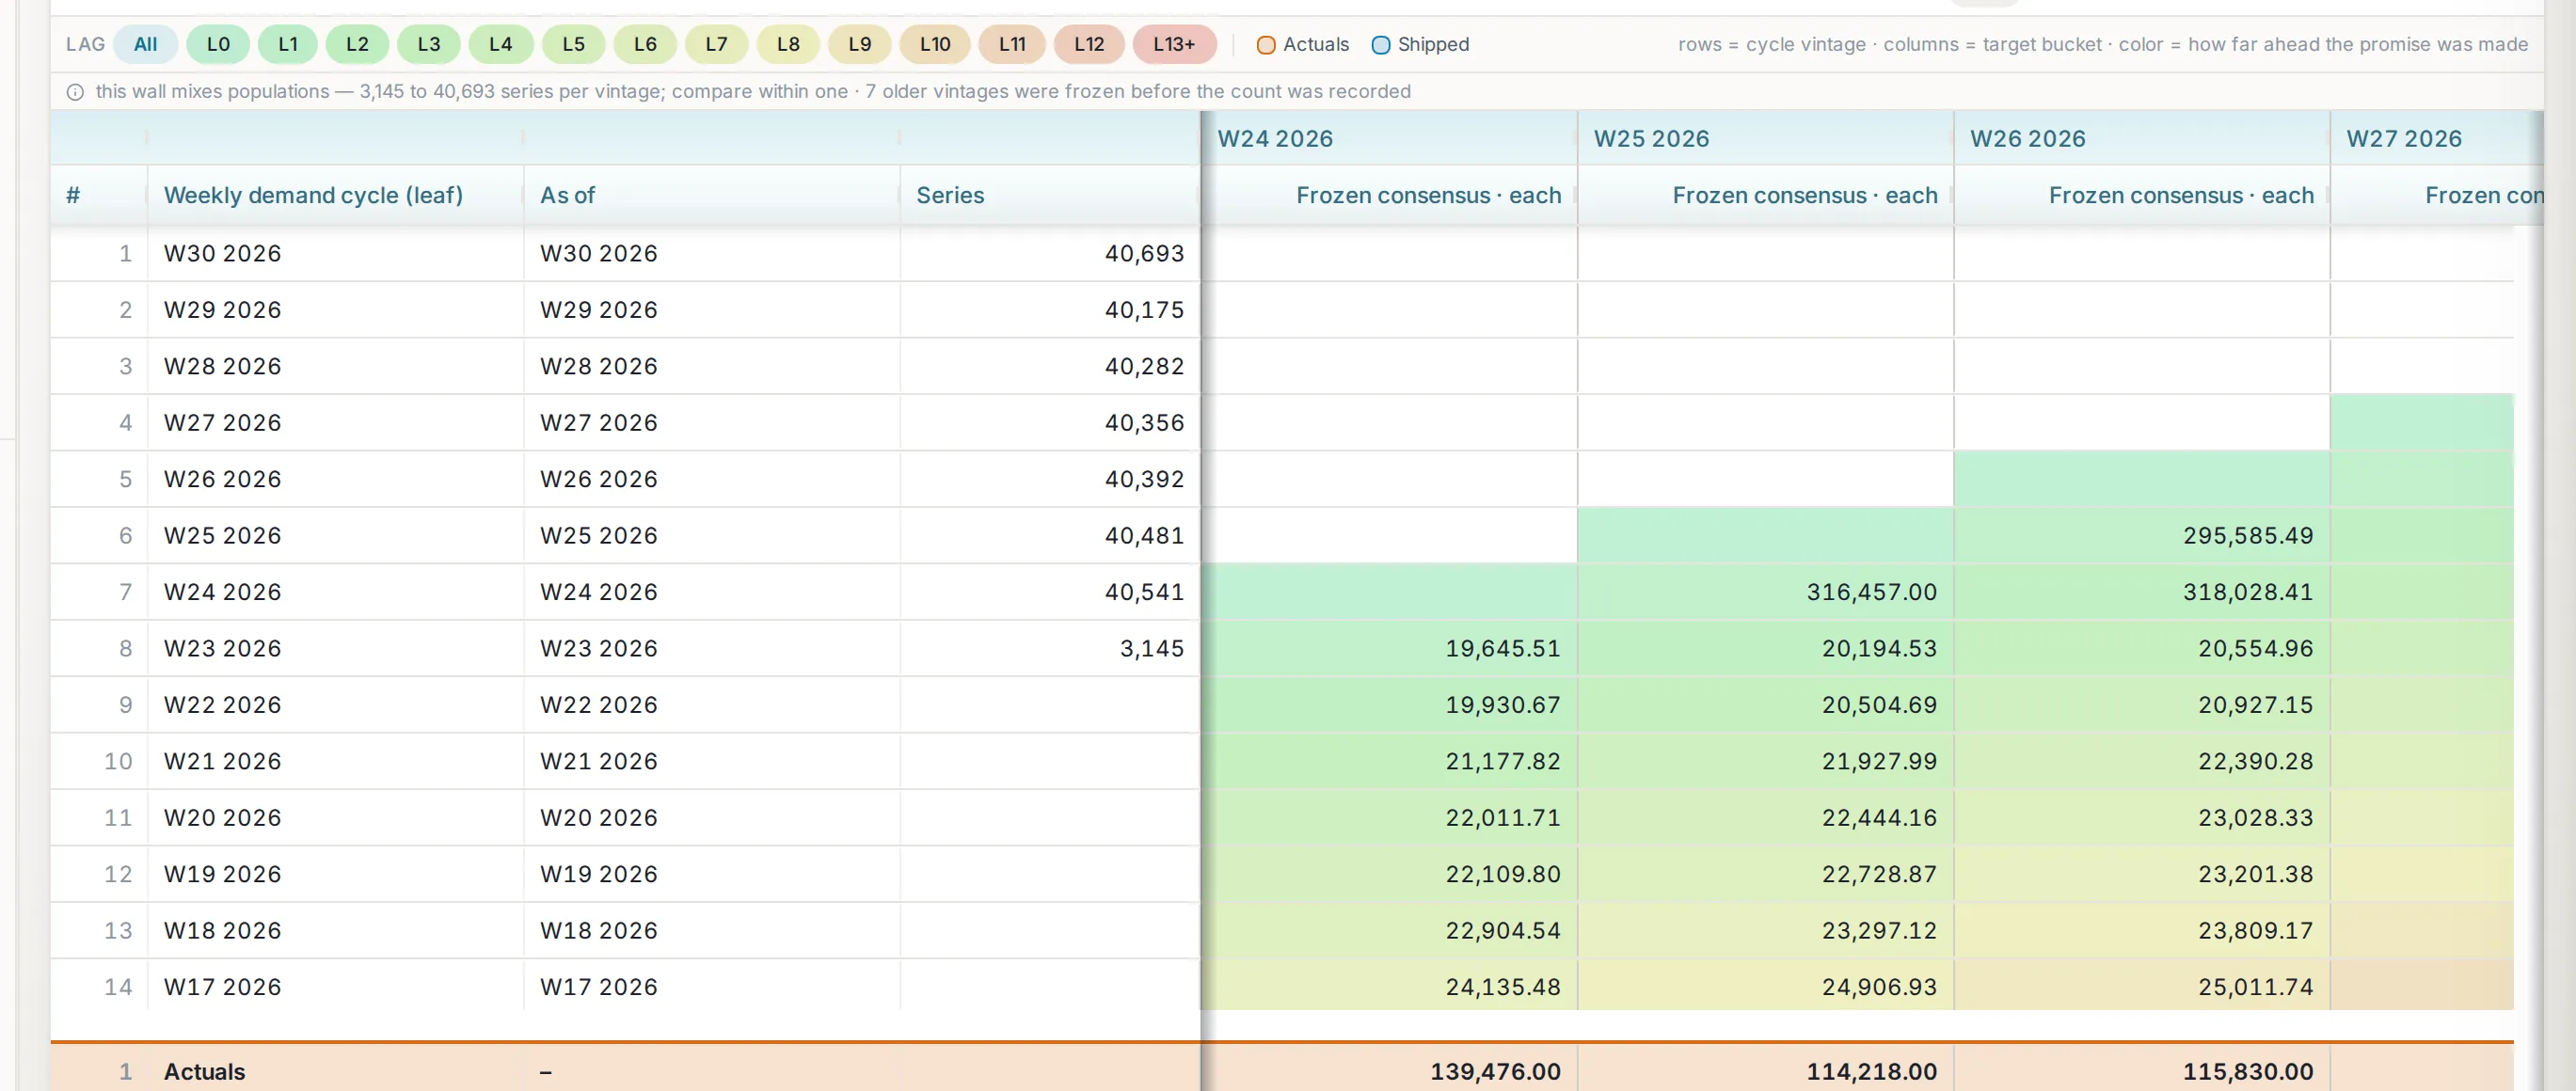
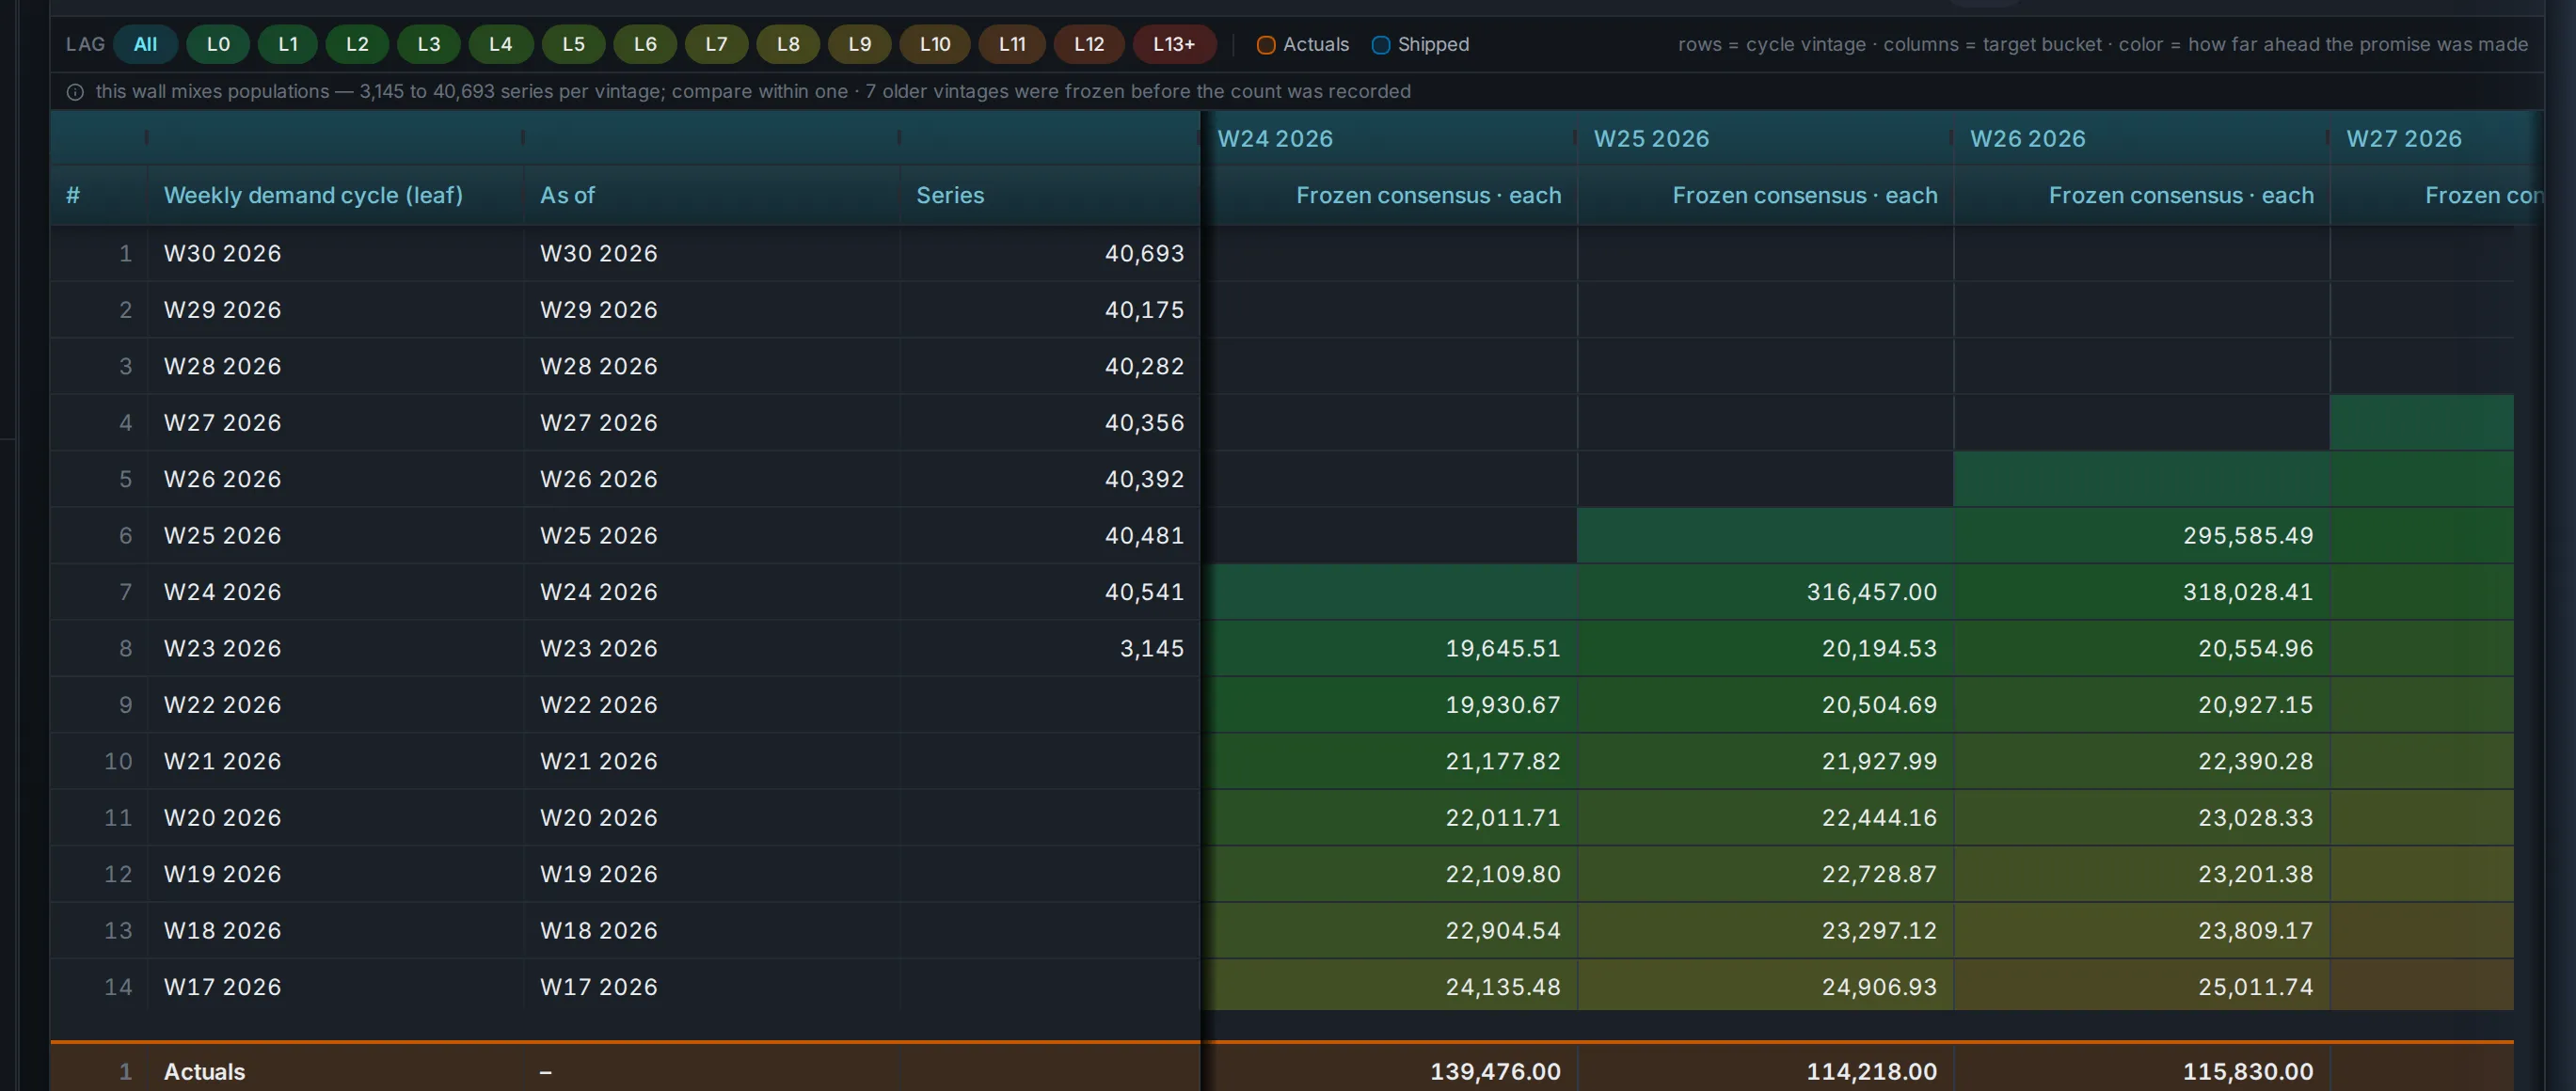
Accuracy, bias and forecast value added are computed every cycle at whatever level you pivot to, from one definition used identically on every screen. If a manual adjustment reduced accuracy, that shows up too, quietly, with the number.
Consensus and what-if
One filter, one room, and a what-if that costs nothing to start.
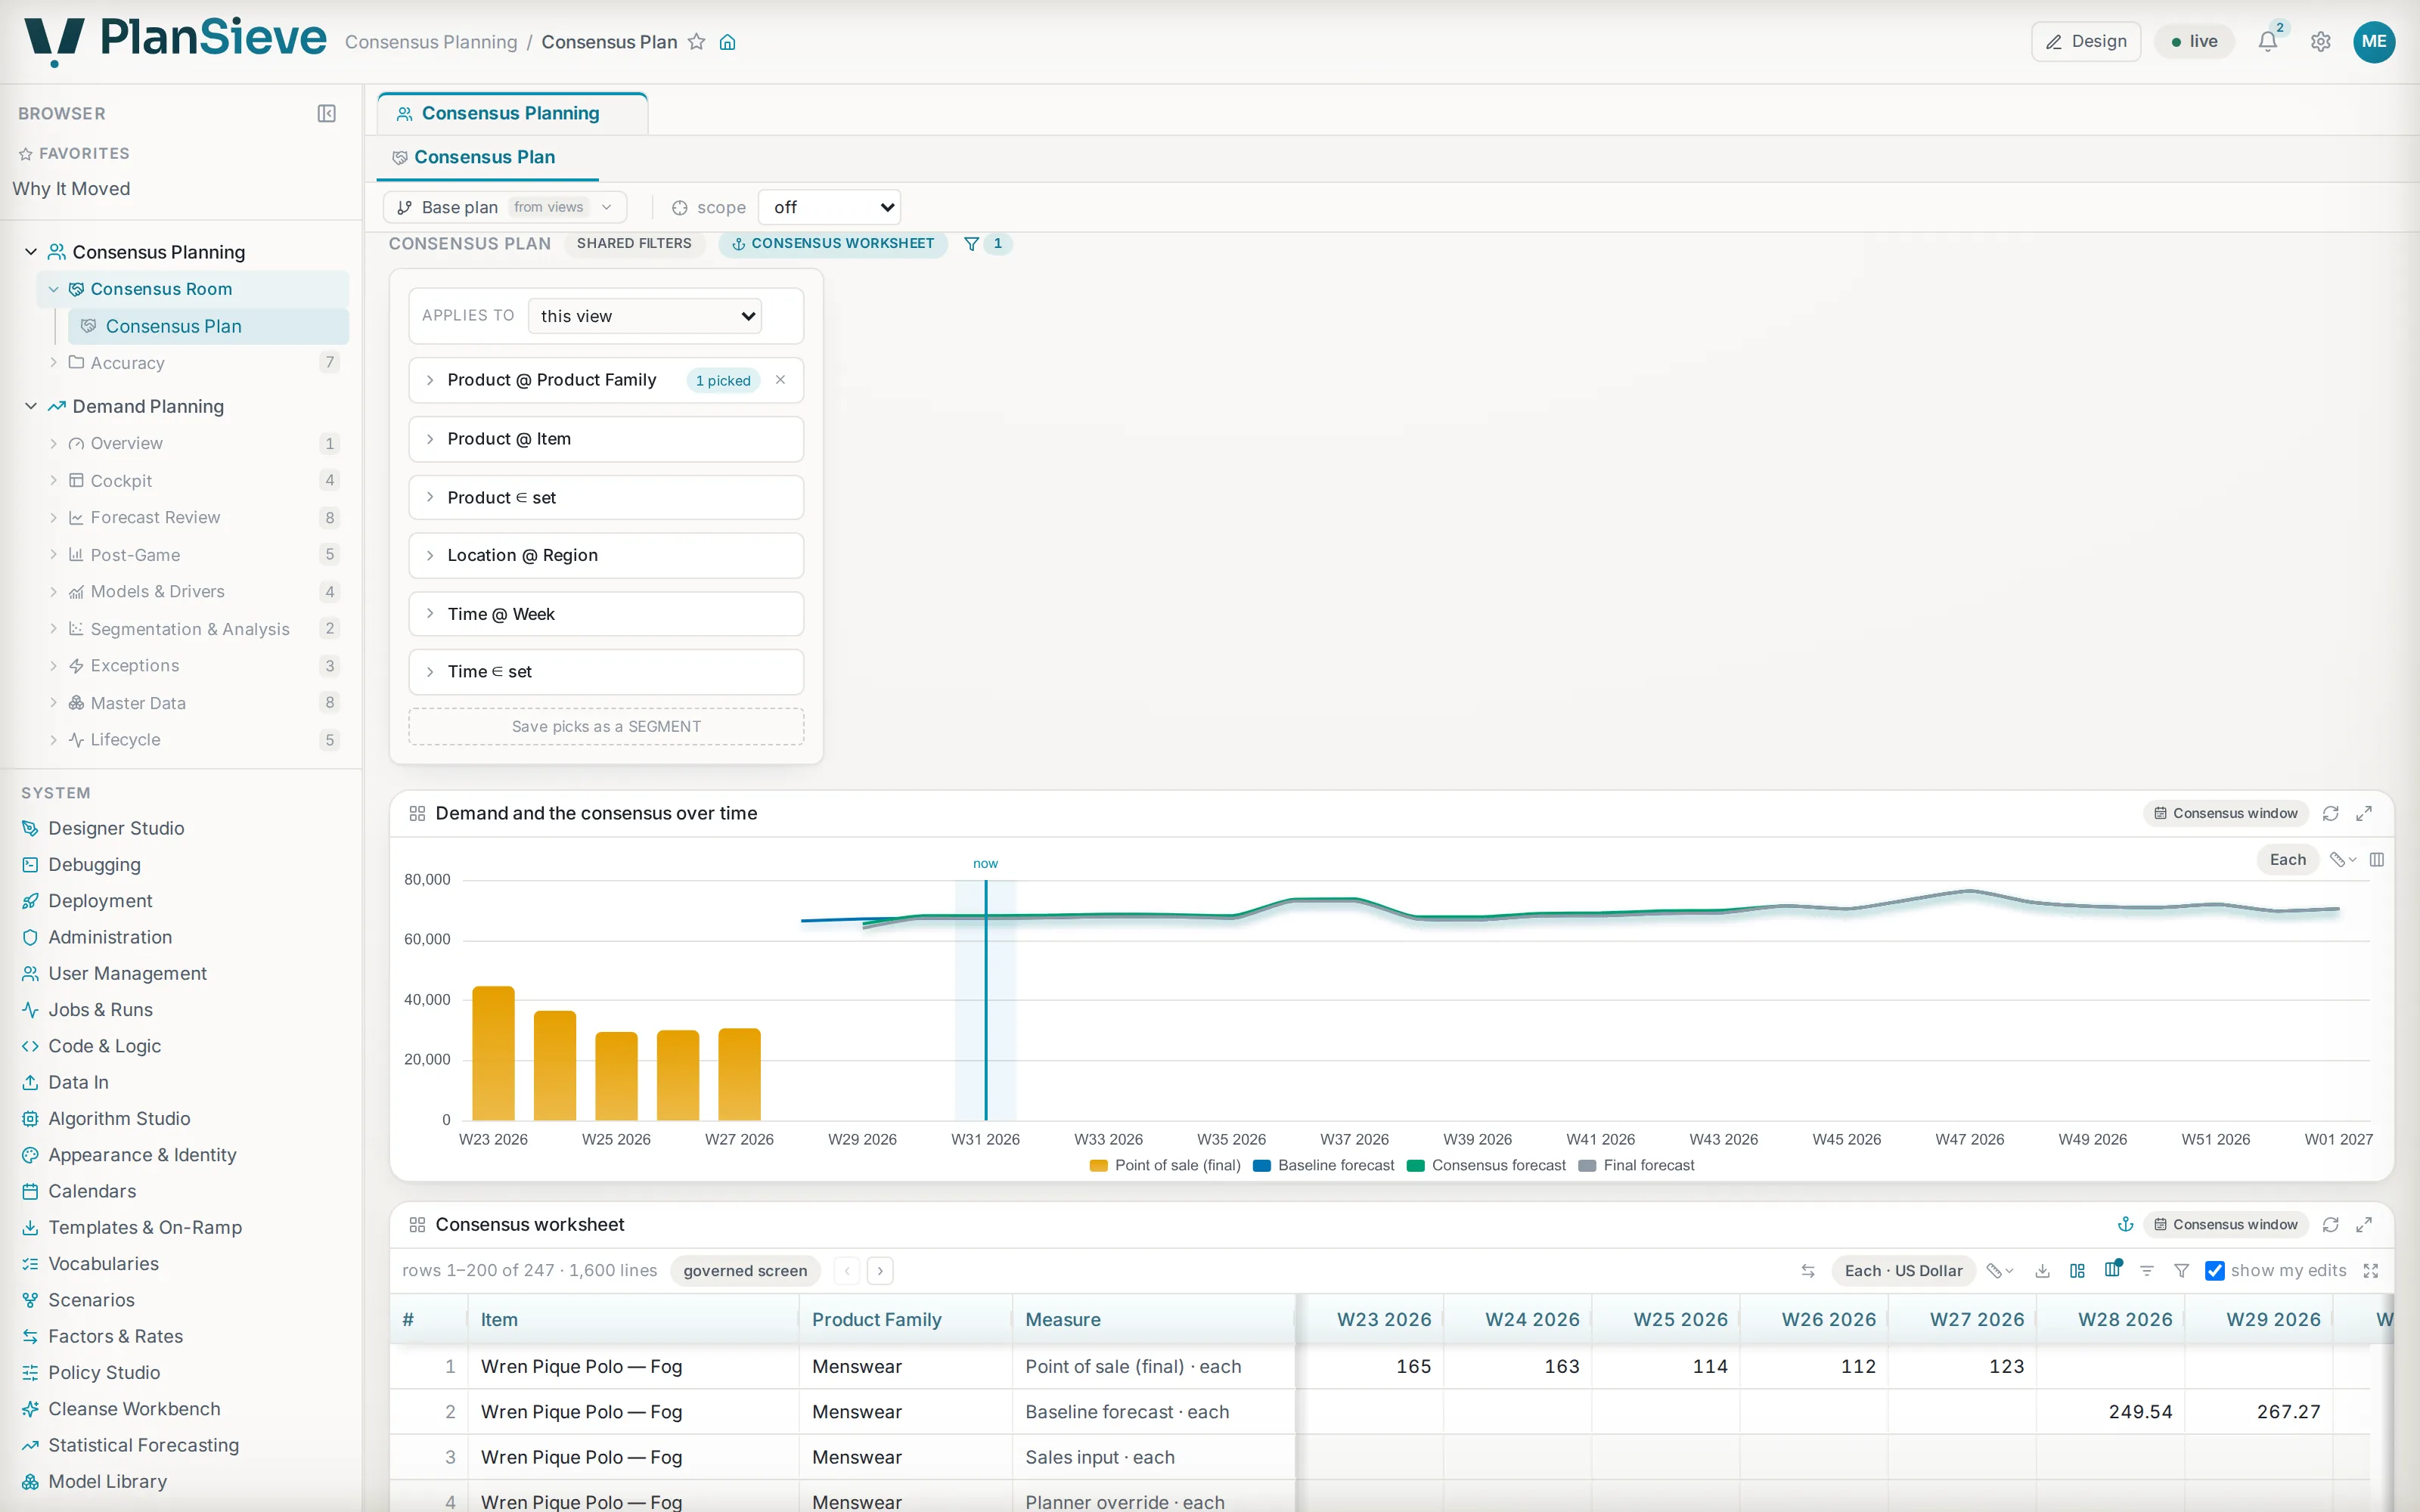
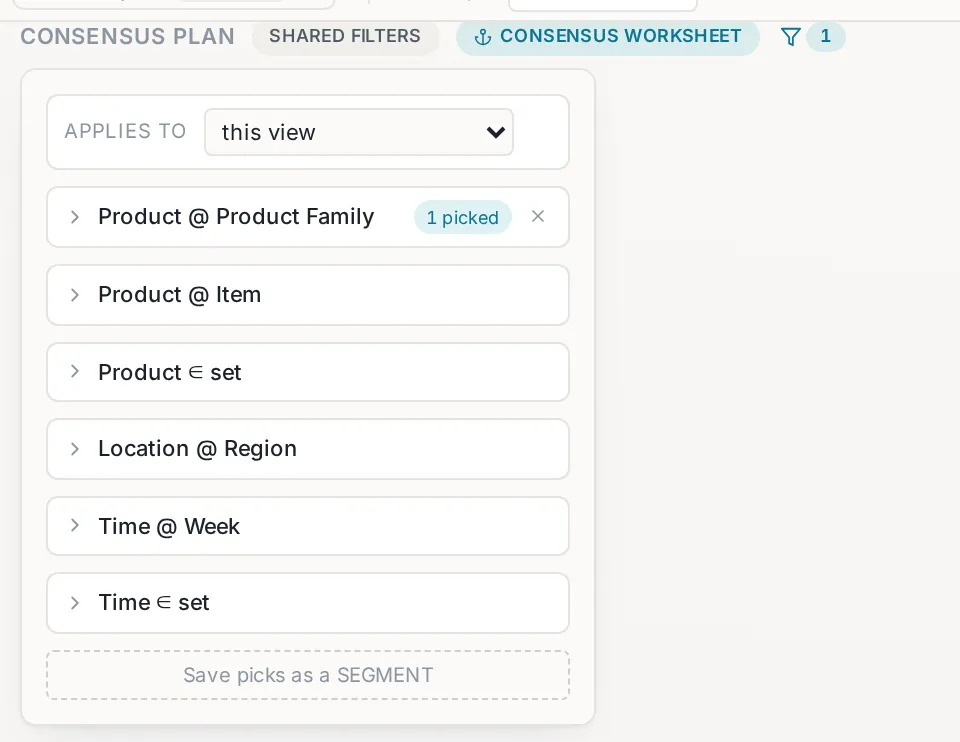
The consensus plan narrows the chart and the worksheet together from one shared filter. A scenario stores only the cells you changed, so trying something is instant, and so is throwing it away.
Walk the day on your own numbers
Bring your history and your hierarchies. We load them, run the contest, and walk the worklist, the verdict and the explanation with you.
a working demo on your data · no commitment